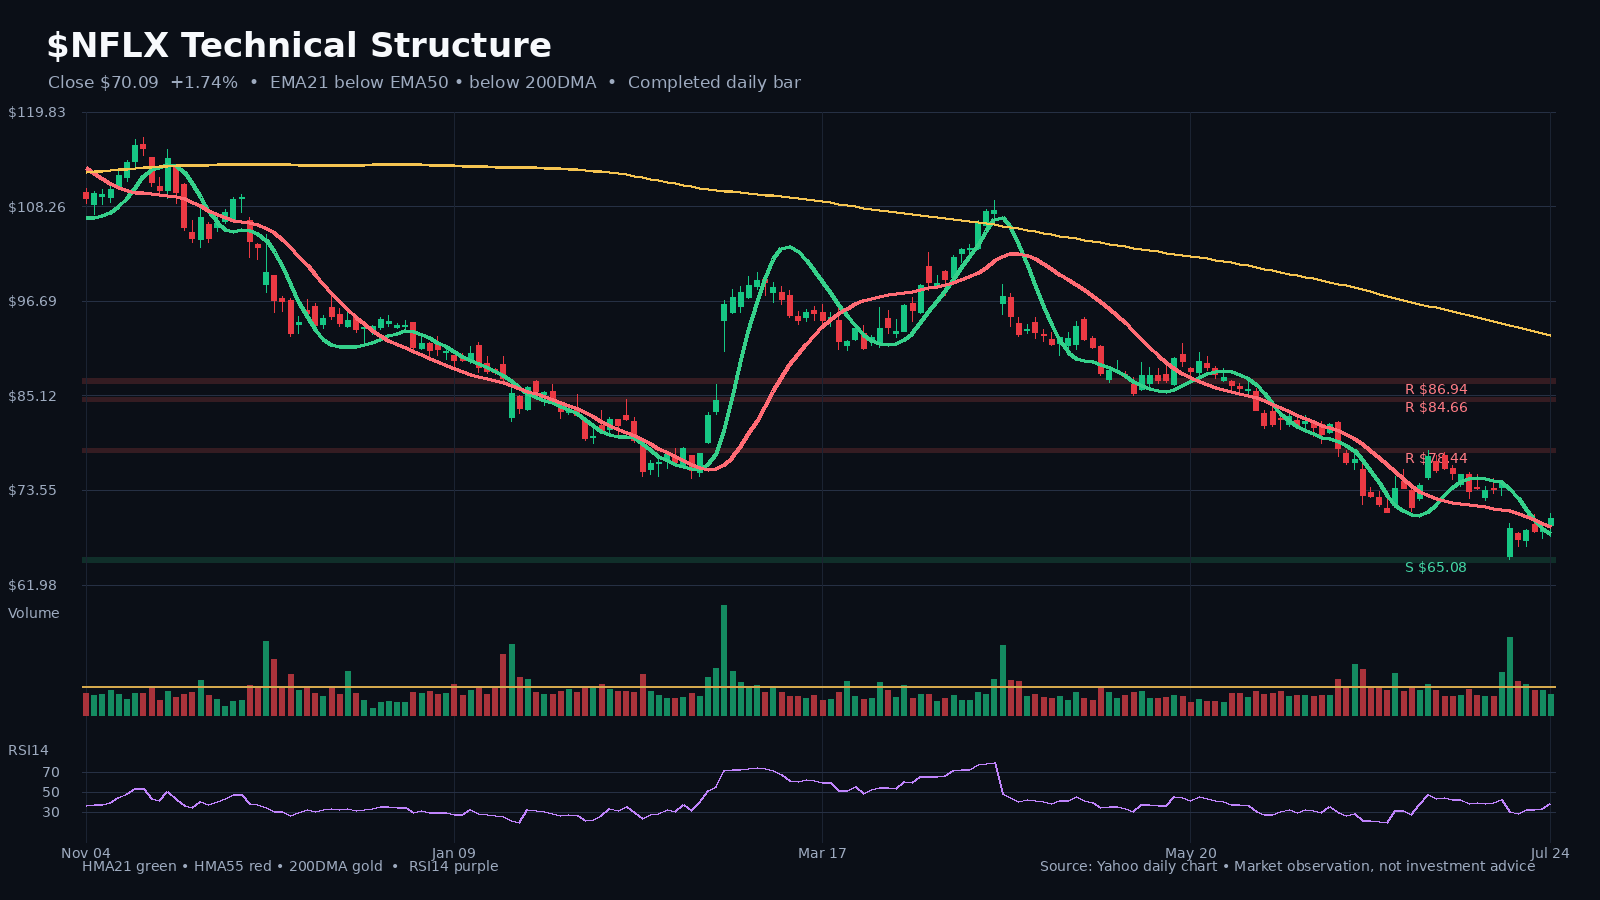
NFLX market-structure snapshot
Latest close on July 24, 2026: $70.09 (+1.7% on the latest daily bar). HMA21 / HMA55: $68.26 / $69.16. 200DMA: $92.53. Relative volume: 0.73x the 20-day average.
Latest close on July 24, 2026: $70.09 (+1.7% on the latest daily bar). HMA21 / HMA55: $68.26 / $69.16. 200DMA: $92.53. Relative volume: 0.73x the 20-day average.
NFLX latest SEC/Yahoo fundamental and valuation snapshot
Latest comparable filing period: 2026 Q2 ending 2026-06-30; filed 2026-07-17. Comparable growth: revenue +13.4% YoY; net income +8.8% YoY; diluted EPS +11.1% YoY.
Latest comparable filing period: 2026 Q2 ending 2026-06-30; filed 2026-07-17.
Comparable growth: revenue +13.4% YoY; net income +8.8% YoY; diluted EPS +11.1% YoY.
Quality and cash conversion: net margin 27.1% (-113 bp YoY); six-month YTD SEC free-cash-flow proxy $6.62B (+34.3% YoY).
Valuation snapshot: trailing P/E 22.0x; forward P/E 18.4x; EV/EBITDA 20.3x; P/S 6.0x.
Cash generation improved versus the comparable period.
Behind Netflix’s “moderate” Q2 results, concerns about slowing growth deepen, and the long-term outlook requires the expansion of new content (Bernstein)
Bernstein's comments on Netflix (NFLX.US) 2Q26 confirmed each other with Goldman Sachs, but emphasized the deepening of "doubts." Revenue, EBIT, and EPS were basically in line with expectations, but UCAN's revenue fell short of expectations. More importantly, the narrowing of the revenue guidance range has triggered market speculation about slowing growth, while the guidance of maintaining profit margins of 31.5% has made investors more cautious about growth prospects.
Bernstein's comments on Netflix (NFLX.US) 2Q26 confirmed each other with Goldman Sachs, but emphasized the deepening of "doubts." Revenue, EBIT, and EPS were basically in line with expectations, but UCAN's revenue fell short of expectations. More importantly, the narrowing of the revenue guidance range has triggered market speculation about slowing growth, while the guidance of maintaining profit margins of 31.5% has made investors more cautious about growth prospects.
After Richemont Group’s 1Q27 results, these 10 questions are key for investors to communicate with management (Morgan Stanley)
After Richemont Group (CFR.S) released its 1Q27 results, Morgan Stanley did not directly make a "bullish" or "short" judgment. Instead, it sorted out 10 core questions to guide investors in communicating with the company's management. These questions cover multiple dimensions such as performance trends, regional performance (especially the slowdown in the Chinese market), business operations, financial performance, management changes and cash planning.
After Richemont Group (CFR.S) released its 1Q27 results, Morgan Stanley did not directly make a "bullish" or "short" judgment. Instead, it sorted out 10 core questions to guide investors in communicating with the company's management. These questions cover multiple dimensions such as performance trends, regional performance (especially the slowdown in the Chinese market), business operations, financial performance, management changes and cash planning.