AlphaWire

stock_deep_dive

DIA market-structure snapshot

2026-07-27·stock-deep-dive-20260727-slot-00-1045-dia
$DIA: multi-source stock research

State Street SPDR Dow Jones Ind

MARKET STRUCTURE

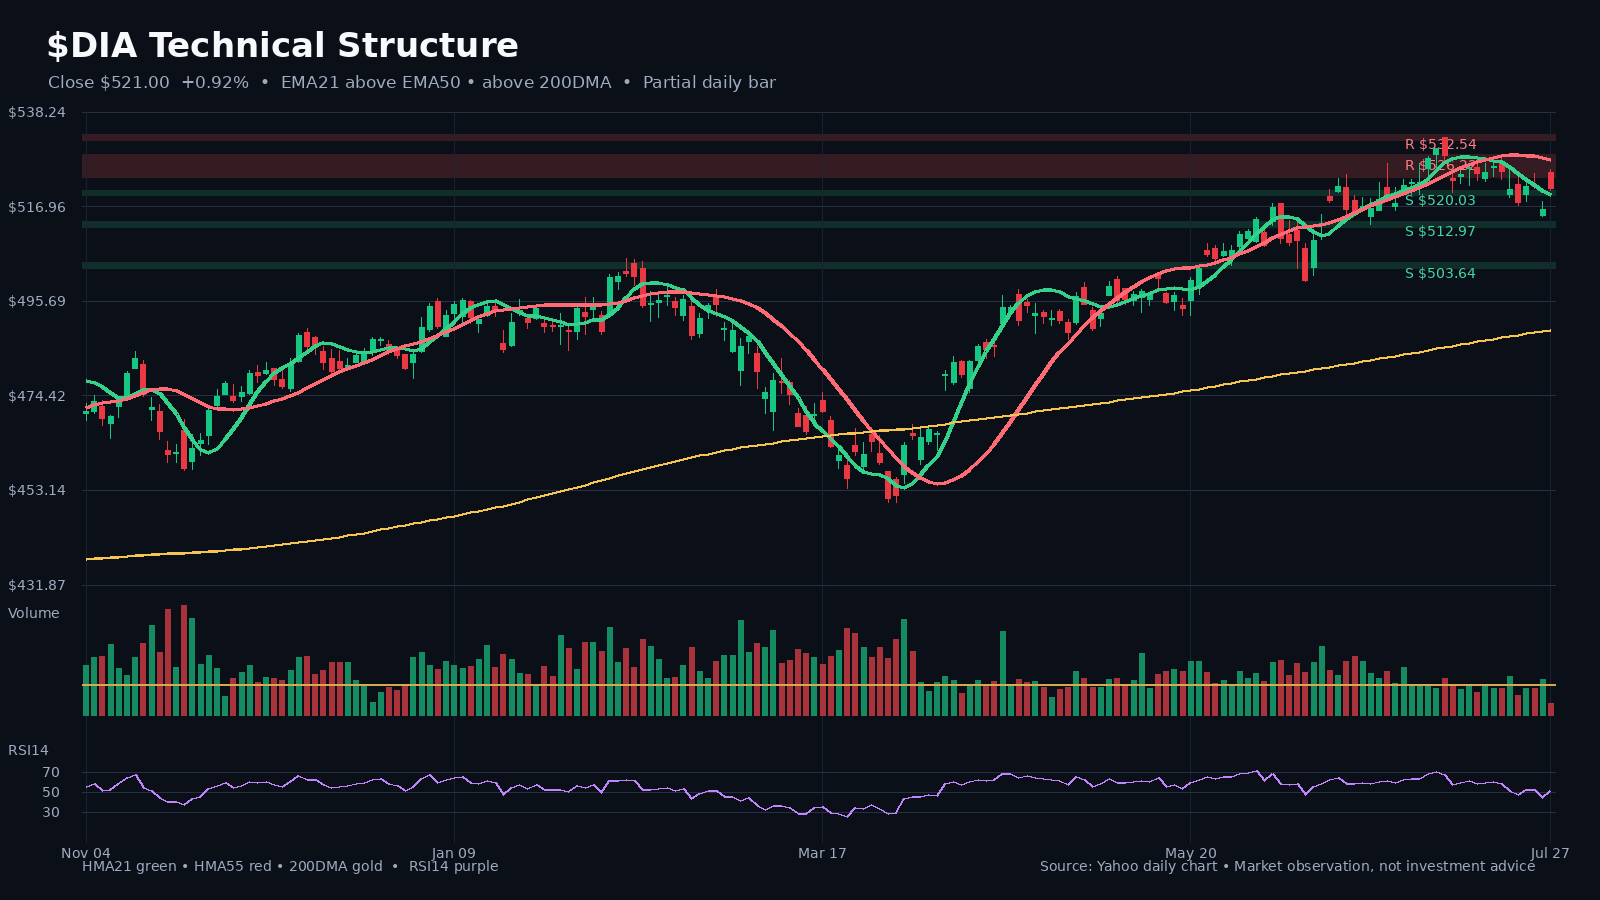
Latest close on July 27, 2026: $521.00 (+0.9% on the latest daily bar).

HMA21 / HMA55: $519.79 / $527.53. 200DMA: $489.13.

Relative volume: 0.38x the 20-day average.

Nearest support/watch zone: $520.50.

Nearest resistance/watch zone: $525.33.

Price is above the 200DMA, so the long-term trend reference is supportive.

FUNDAMENTALS AND VALUATION

No reliable comparable SEC fundamental snapshot was available for this symbol.

BOTTOM LINE

The technical structure is mixed.

WHAT TO WATCH

• Holding above HMA21 near $519.79 would preserve the short-term structure.
• A close below the nearby support zone around $520.50 would weaken the setup.

Research and technical observation only; not a trade recommendation.

#Stocks #Fundamentals #TechnicalAnalysis #DIA

Charts

DIA chart 1
DIA chart 1

Full text

DIA market-structure snapshot

Latest close on July 27, 2026: $521.00 (+0.9% on the latest daily bar). HMA21 / HMA55: $519.79 / $527.53. 200DMA: $489.13. Relative volume: 0.38x the 20-day average.

Latest close on July 27, 2026: $521.00 (+0.9% on the latest daily bar). HMA21 / HMA55: $519.79 / $527.53. 200DMA: $489.13. Relative volume: 0.38x the 20-day average.

← Back to archive