AlphaWire

stock_deep_dive

BA market-structure snapshot

2026-07-27·stock-deep-dive-20260727-slot-07-1230-ba
$BA: multi-source stock research

THE BOEING COMPANY

MARKET STRUCTURE

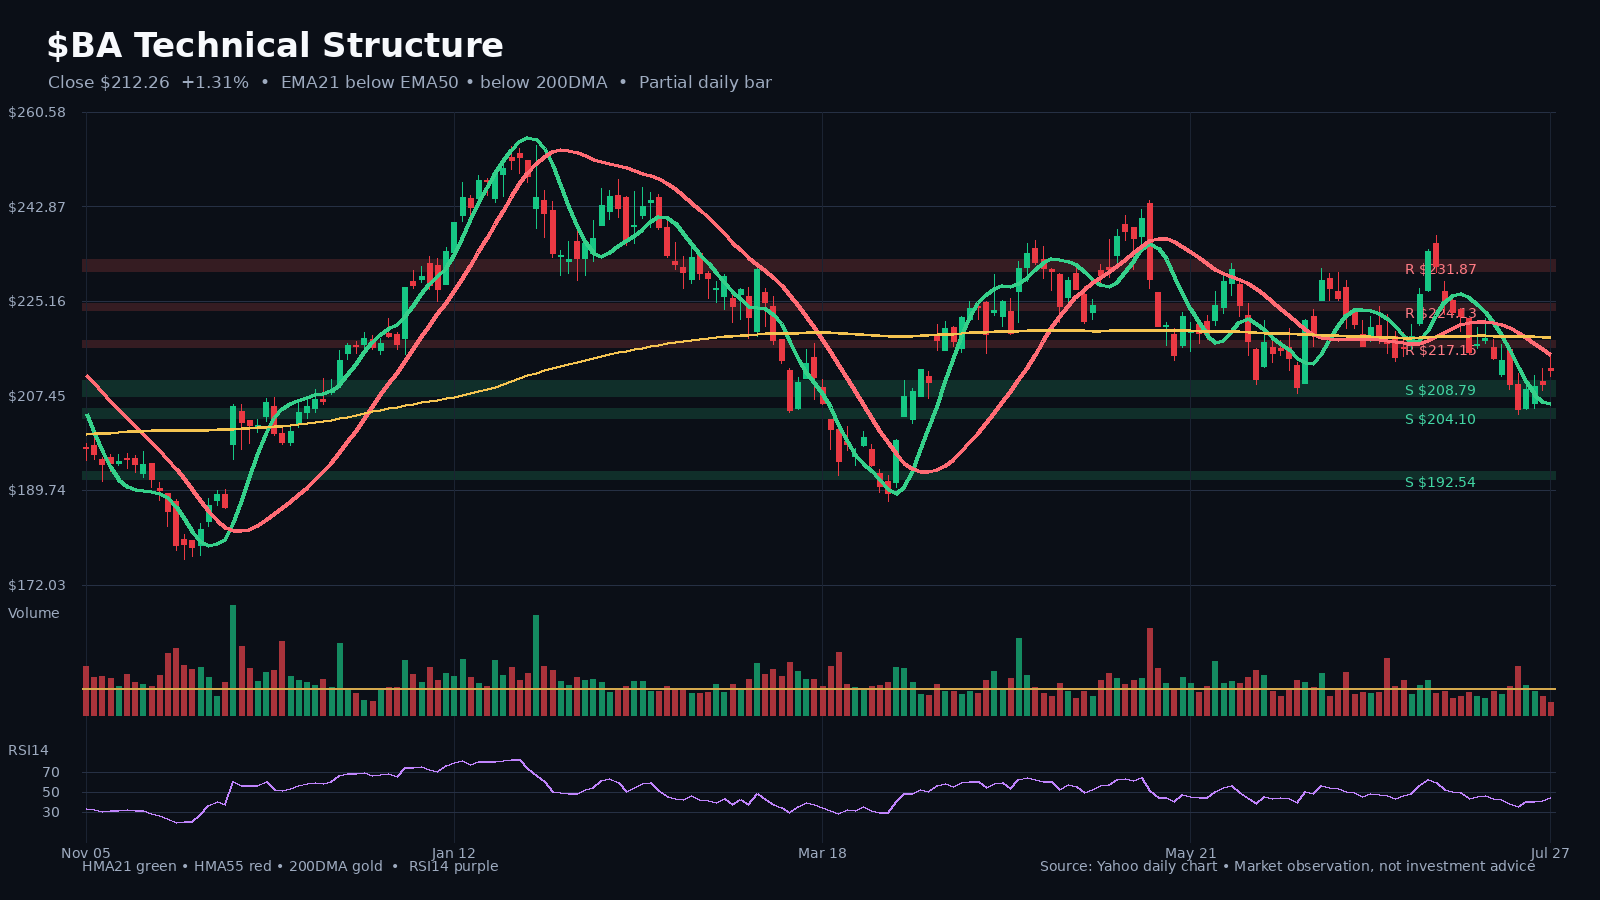
Latest close on July 27, 2026: $212.26 (+1.3% on the latest daily bar).

HMA21 / HMA55: $206.04 / $215.23. 200DMA: $218.36.

Relative volume: 0.46x the 20-day average.

Nearest support/watch zone: $211.15.

Nearest resistance/watch zone: $215.22.

Price is below the 200DMA, so the long-term trend reference is still defensive.

FUNDAMENTALS AND VALUATION

Latest comparable filing period: 2026 Q1 ending 2026-03-31; filed 2026-04-22.

Comparable growth: revenue +14.0% YoY; net income -89.2% YoY; diluted EPS -31.2% YoY.

Quality and cash conversion: net margin -0.0% (+17 bp YoY); quarterly SEC free-cash-flow proxy -$1.45B (+36.5% YoY).

Valuation snapshot: trailing P/E 83.6x; forward P/E 51.9x; P/S 1.8x.

Read-through:
• Revenue growth did not convert into net-income growth in the comparable period.
• Cash generation improved versus the comparable period.

BOTTOM LINE

The technical structure is mixed, while the latest comparable period showed revenue growth but weaker profit conversion. The next confirmation must come from both price structure and the next reported operating data—not from narrative alone.

WHAT TO WATCH

• Holding above HMA21 near $206.04 would preserve the short-term structure.
• A close below the nearby support zone around $211.15 would weaken the setup.
• Whether the next filing confirms that revenue growth is converting into net income, EPS and cash flow.

Research and technical observation only; not a trade recommendation.

#Stocks #Fundamentals #TechnicalAnalysis #BA

Charts

BA chart 1
BA chart 1

Full text

BA market-structure snapshot

Latest close on July 27, 2026: $212.26 (+1.3% on the latest daily bar). HMA21 / HMA55: $206.04 / $215.23. 200DMA: $218.36. Relative volume: 0.46x the 20-day average.

Latest close on July 27, 2026: $212.26 (+1.3% on the latest daily bar). HMA21 / HMA55: $206.04 / $215.23. 200DMA: $218.36. Relative volume: 0.46x the 20-day average.

BA latest SEC/Yahoo fundamental and valuation snapshot

Latest comparable filing period: 2026 Q1 ending 2026-03-31; filed 2026-04-22. Comparable growth: revenue +14.0% YoY; net income -89.2% YoY; diluted EPS -31.2% YoY.

Latest comparable filing period: 2026 Q1 ending 2026-03-31; filed 2026-04-22.
Comparable growth: revenue +14.0% YoY; net income -89.2% YoY; diluted EPS -31.2% YoY.
Quality and cash conversion: net margin -0.0% (+17 bp YoY); quarterly SEC free-cash-flow proxy -$1.45B (+36.5% YoY).
Valuation snapshot: trailing P/E 83.6x; forward P/E 51.9x; P/S 1.8x.
Revenue growth did not convert into net-income growth in the comparable period.
Cash generation improved versus the comparable period.
← Back to archive