AlphaWire

stock_deep_dive

NVO market-structure snapshot

2026-07-28·stock-deep-dive-20260728-slot-14-1415-nvo
$NVO: multi-source stock research

NOVO NORDISK A/S

MARKET STRUCTURE

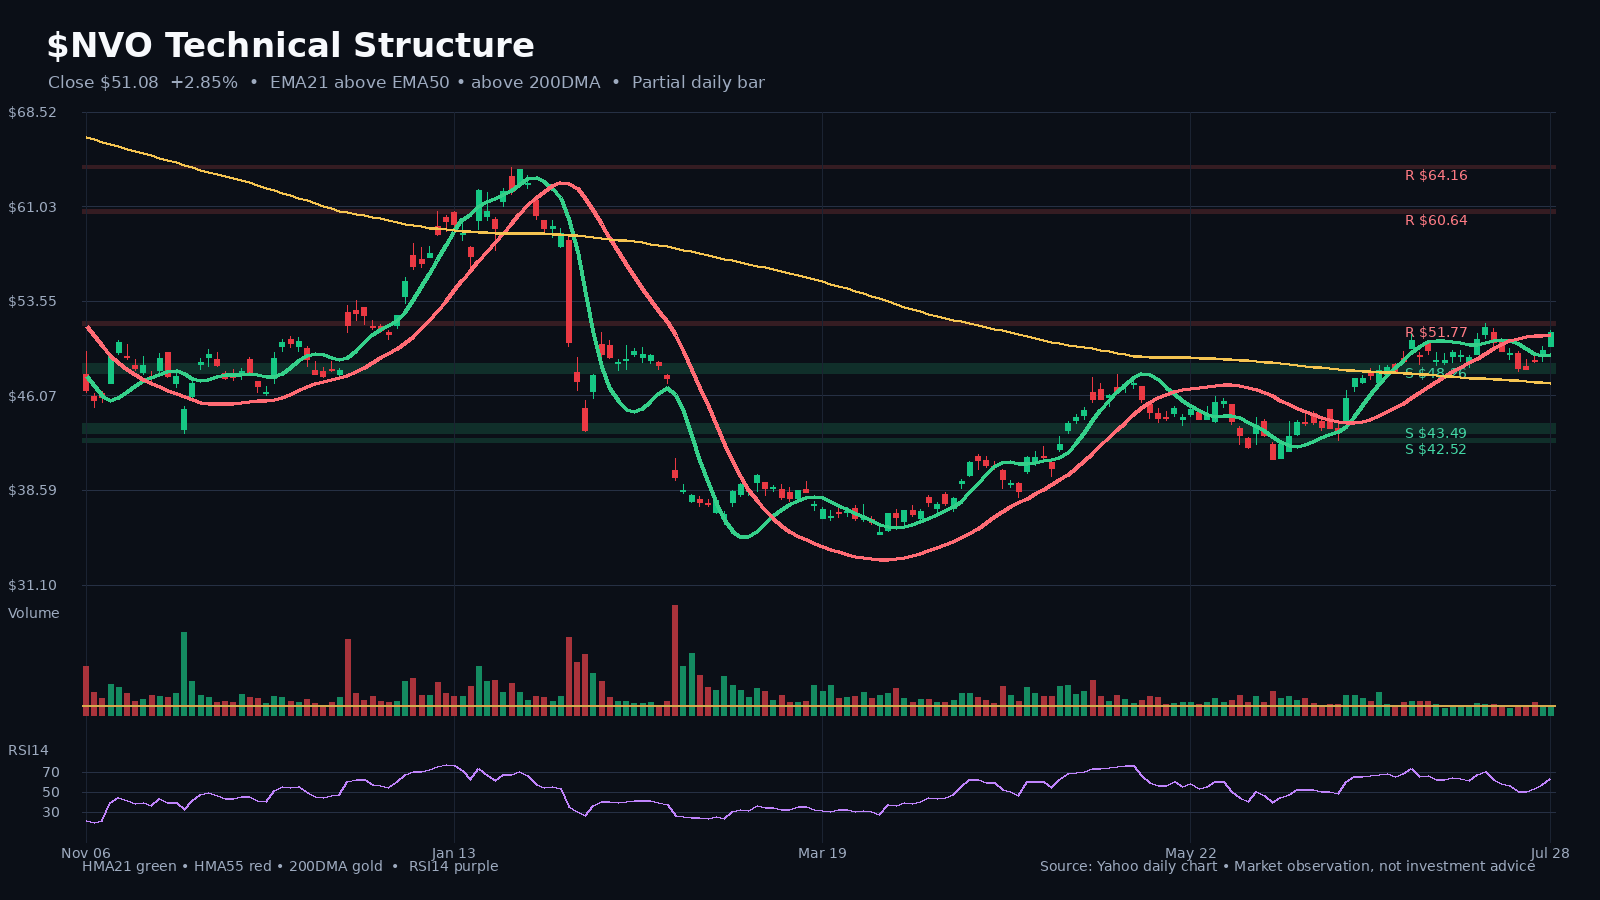
Latest close on July 28, 2026: $51.08 (+2.8% on the latest daily bar).

HMA21 / HMA55: $49.31 / $50.94. 200DMA: $47.06.

Relative volume: 0.74x the 20-day average.

Nearest support/watch zone: $50.00.

Nearest resistance/watch zone: $51.22.

Price is above the 200DMA, so the long-term trend reference is supportive.

FUNDAMENTALS AND VALUATION

Latest comparable filing period: latest period.

Valuation snapshot: trailing P/E 12.3x; forward P/E 15.7x; EV/EBITDA 2.0x; P/S 0.7x.

Read-through:
• forward P/E is above trailing P/E, implying softer expected earnings

RECENT INSTITUTIONAL RESEARCH

• 2026-07-09 — The GLP-1 drug market feast continues, with weight loss and hypoglycemic dual-wheel drive sales exploding (Nomura)

Nomura Securities released an anchor report in the GLP-1 field, pointing out that the market’s “harvest period” continues.

Data show that in the first quarter of 2026, sales of Semaglutide (total Novo Nordisk product line) reached US$21.284 billion, and sales of Tirzepatide (total Eli Lilly product line) reached US$3.741 billion, with year-on-year growth rates both maintaining above 50%.

In the weight loss market, the competition between Wegovy and Zepbound is fierce, with Q1 2026 sales of US$3.3 billion and US$4.1 billion respectively.
BOTTOM LINE

The technical structure is constructive.

WHAT TO WATCH

• Holding above HMA21 near $49.31 would preserve the short-term structure.
• A close below the nearby support zone around $50.00 would weaken the setup.
• Whether the operating milestones identified in recent institutional research become measurable disclosures.

Research and technical observation only; not a trade recommendation.

#Stocks #Fundamentals #TechnicalAnalysis #NVO

Charts

NVO chart 1
NVO chart 1

Full text

NVO market-structure snapshot

Latest close on July 28, 2026: $51.08 (+2.8% on the latest daily bar). HMA21 / HMA55: $49.31 / $50.94. 200DMA: $47.06. Relative volume: 0.74x the 20-day average.

Latest close on July 28, 2026: $51.08 (+2.8% on the latest daily bar). HMA21 / HMA55: $49.31 / $50.94. 200DMA: $47.06. Relative volume: 0.74x the 20-day average.

NVO latest SEC/Yahoo fundamental and valuation snapshot

Latest comparable filing period: latest period. Valuation snapshot: trailing P/E 12.3x; forward P/E 15.7x; EV/EBITDA 2.0x; P/S 0.7x.

Latest comparable filing period: latest period.
Valuation snapshot: trailing P/E 12.3x; forward P/E 15.7x; EV/EBITDA 2.0x; P/S 0.7x.
forward P/E is above trailing P/E, implying softer expected earnings

The GLP-1 drug market feast continues, with weight loss and hypoglycemic dual-wheel drive sales exploding (Nomura)

Nomura Securities released an anchor report in the GLP-1 field, pointing out that the market’s “harvest period” continues. Data show that in the first quarter of 2026, sales of Semaglutide (total Novo Nordisk product line) reached US$21.284 billion, and sales of Tirzepatide (total Eli Lilly product line) reached US$3.741 billion, with year-on-year growth rates both maintaining above 50%. In the weight loss market, the competition between Wegovy and Zepbound is fierce, with Q1 2026 sales of US$3.3 billion and US$4.1 billion respectively.

Nomura Securities released an anchor report in the GLP-1 field, pointing out that the market’s “harvest period” continues. Data show that in the first quarter of 2026, sales of Semaglutide (total Novo Nordisk product line) reached US$21.284 billion, and sales of Tirzepatide (total Eli Lilly product line) reached US$3.741 billion, with year-on-year growth rates both maintaining above 50%. In the weight loss market, the competition between Wegovy and Zepbound is fierce, with Q1 2026 sales of US$3.3 billion and US$4.1 billion respectively.

← Back to archive