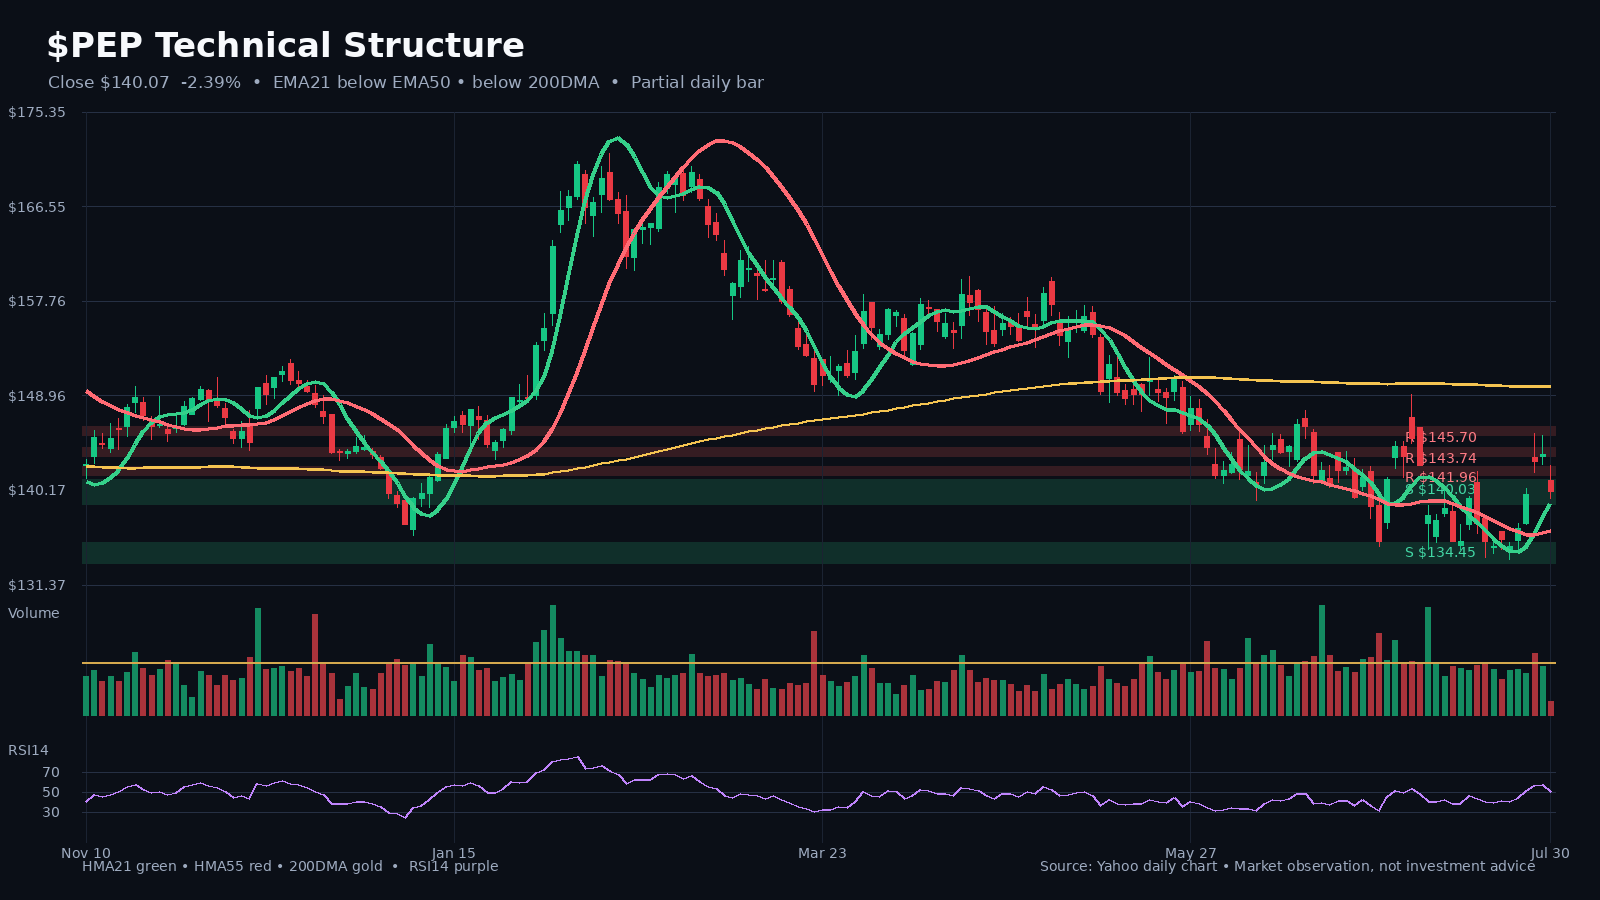
PEP market-structure snapshot
Latest close on July 30, 2026: $140.07 (-2.4% on the latest daily bar). HMA21 / HMA55: $138.99 / $136.49. 200DMA: $149.79. Relative volume: 0.26x the 20-day average.
Latest close on July 30, 2026: $140.07 (-2.4% on the latest daily bar). HMA21 / HMA55: $138.99 / $136.49. 200DMA: $149.79. Relative volume: 0.26x the 20-day average.
PEP latest SEC/Yahoo fundamental and valuation snapshot
Latest comparable filing period: 2026 Q2 ending 2026-06-13; filed 2026-07-09. Comparable growth: revenue +6.4% YoY; net income +136.0% YoY; diluted EPS +137.0% YoY.
Latest comparable filing period: 2026 Q2 ending 2026-06-13; filed 2026-07-09.
Comparable growth: revenue +6.4% YoY; net income +136.0% YoY; diluted EPS +137.0% YoY.
Quality and cash conversion: net margin 12.3% (+677 bp YoY).
Valuation snapshot: trailing P/E 18.4x; forward P/E 15.6x; EV/EBITDA 12.6x; P/S 2.0x.
Net income grew faster than revenue, indicating positive earnings leverage in the comparable period.
Domestic headwinds weigh on organic growth and valuation: PepsiCo Q2 earnings review (Bernstein)
Bernstein commented on PepsiCo’s (PEP) Q2 results, saying pressure in North America is weighing on the company’s organic growth and valuation multiple. According to the report, Bernstein forecasts PepsiCo’s next-twelve-months (NTM) organic sales growth at 2.7%, below the market consensus of 3.3%. Its EPS estimate is $8.50, also below the market estimate of $8.79.
Bernstein commented on PepsiCo’s (PEP) Q2 results, saying pressure in North America is weighing on the company’s organic growth and valuation multiple. According to the report, Bernstein forecasts PepsiCo’s next-twelve-months (NTM) organic sales growth at 2.7%, below the market consensus of 3.3%. Its EPS estimate is $8.50, also below the market estimate of $8.79.