CIEN market-structure snapshot
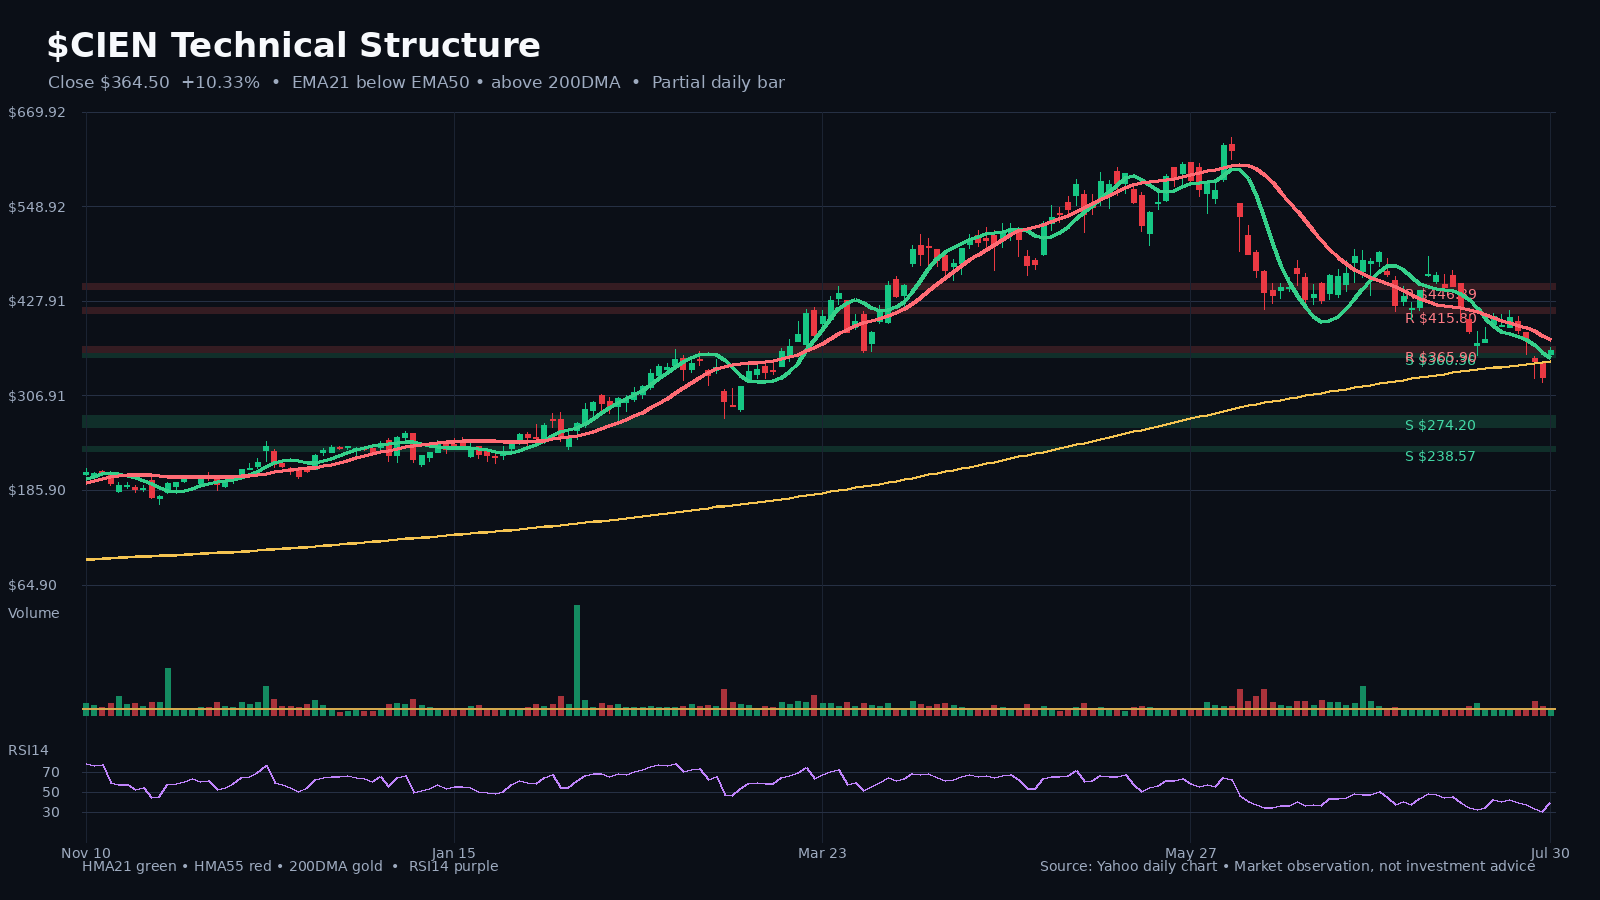
Latest close on July 30, 2026: $364.50 (+10.3% on the latest daily bar). HMA21 / HMA55: $355.49 / $379.10. 200DMA: $350.16. Relative volume: 0.65x the 20-day average.
Latest close on July 30, 2026: $364.50 (+10.3% on the latest daily bar). HMA21 / HMA55: $355.49 / $379.10. 200DMA: $350.16. Relative volume: 0.65x the 20-day average.
CIEN latest SEC/Yahoo fundamental and valuation snapshot
Latest comparable filing period: 2026 Q2 ending 2026-05-02; filed 2026-06-04. Comparable growth: revenue +39.5% YoY; net income +2333.0% YoY; diluted EPS +2383.3% YoY.
Latest comparable filing period: 2026 Q2 ending 2026-05-02; filed 2026-06-04.
Comparable growth: revenue +39.5% YoY; net income +2333.0% YoY; diluted EPS +2383.3% YoY.
Quality and cash conversion: net margin 13.9% (+1310 bp YoY); six-month YTD SEC free-cash-flow proxy $372.41M (+81.6% YoY).
Valuation snapshot: trailing P/E 121.1x; forward P/E 37.8x; EV/EBITDA 60.0x; P/S 9.3x.
Net income grew faster than revenue, indicating positive earnings leverage in the comparable period.
Cash generation improved versus the comparable period.