XOM market-structure snapshot
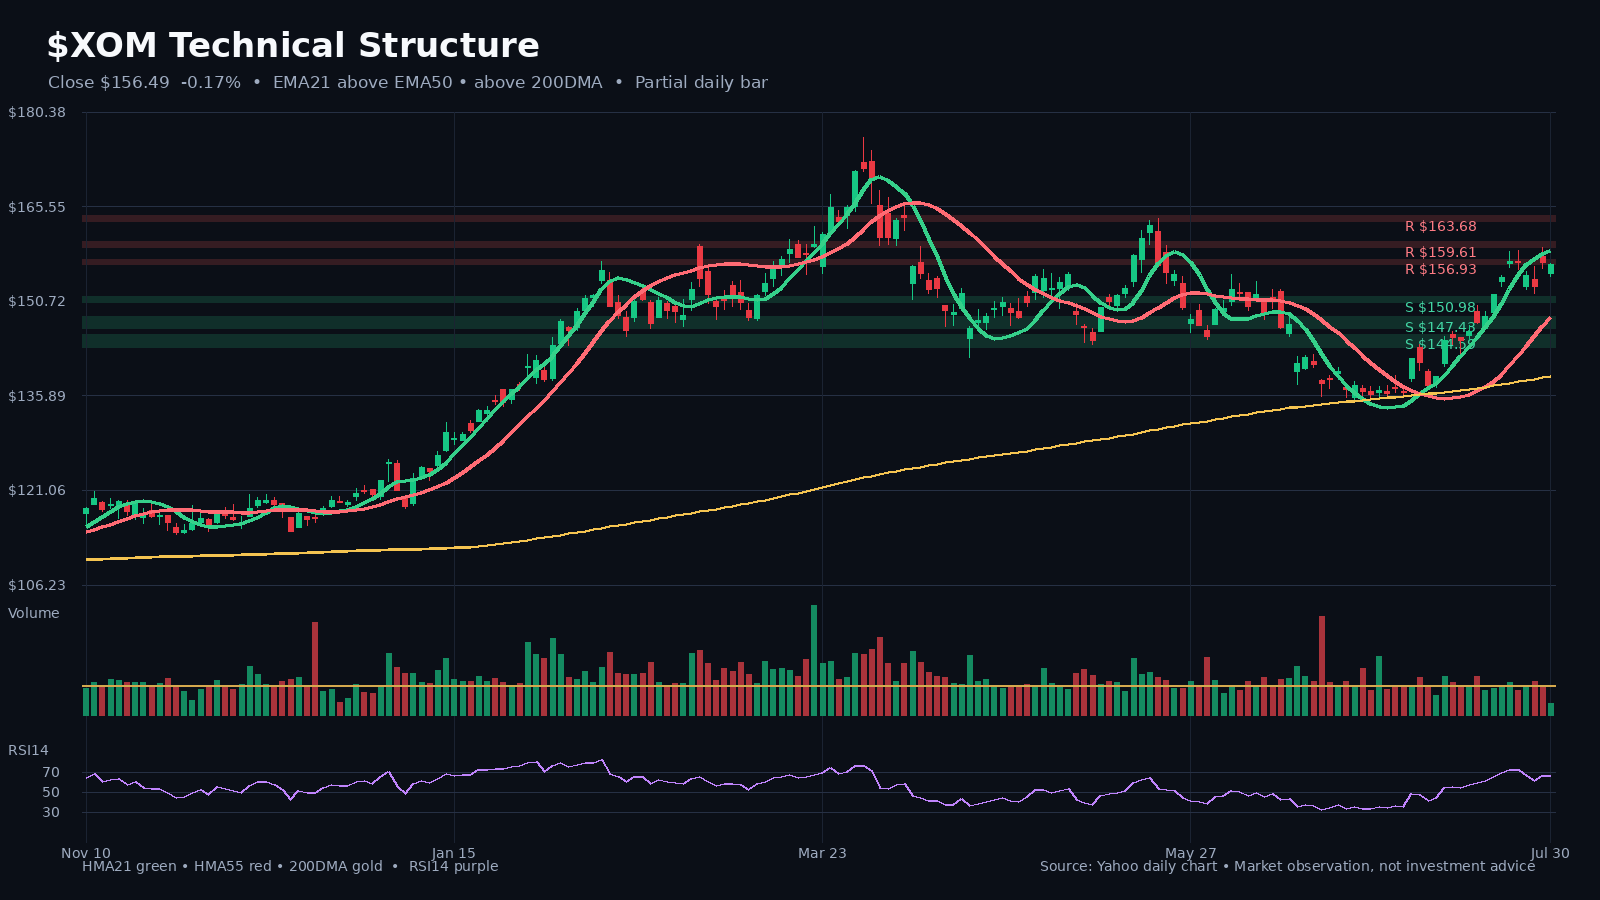
Latest close on July 30, 2026: $156.49 (-0.2% on the latest daily bar). HMA21 / HMA55: $158.72 / $148.20. 200DMA: $138.94. Relative volume: 0.37x the 20-day average.
Latest close on July 30, 2026: $156.49 (-0.2% on the latest daily bar). HMA21 / HMA55: $158.72 / $148.20. 200DMA: $138.94. Relative volume: 0.37x the 20-day average.
XOM latest SEC/Yahoo fundamental and valuation snapshot
Latest comparable filing period: latest period. Valuation snapshot: trailing P/E 26.3x; forward P/E 14.6x; EV/EBITDA 12.4x; P/S 2.0x.
Latest comparable filing period: latest period.
Valuation snapshot: trailing P/E 26.3x; forward P/E 14.6x; EV/EBITDA 12.4x; P/S 2.0x.
forward P/E is materially below trailing P/E, implying higher expected earnings