AlphaWire

stock_deep_dive

GS market-structure snapshot

2026-07-30·stock-deep-dive-20260730-slot-19-1530-gs
$GS: multi-source stock research

The Goldman Sachs Group, Inc.

MARKET STRUCTURE

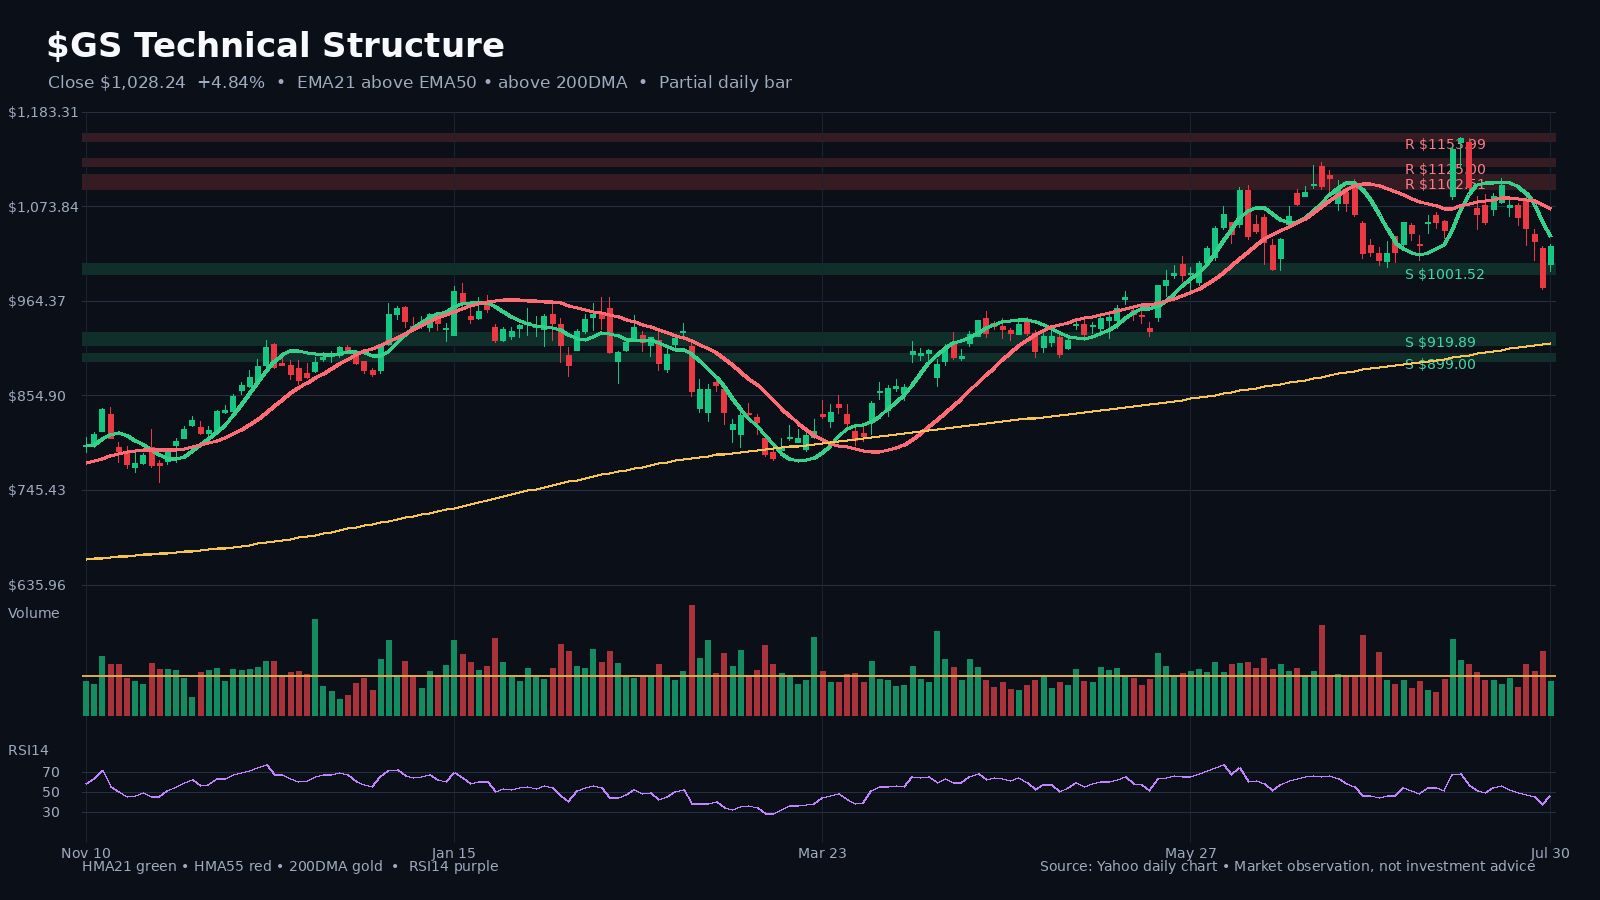
Latest close on July 30, 2026: $1,028.24 (+4.8% on the latest daily bar).

HMA21 / HMA55: $1,039.37 / $1,071.41. 200DMA: $915.34.

Relative volume: 0.85x the 20-day average.

Nearest support/watch zone: $1,001.52.

Nearest resistance/watch zone: $1,029.79.

Price is above the 200DMA, so the long-term trend reference is supportive.

FUNDAMENTALS AND VALUATION

Latest comparable filing period: latest period.

Comparable growth: net income +18.8% YoY; diluted EPS +24.3% YoY.

Quality and cash conversion: quarterly SEC free-cash-flow proxy -$32.43B (+14.0% YoY).

Valuation snapshot: trailing P/E 15.9x; forward P/E 13.9x; P/S 4.5x.

Read-through:
• Cash generation improved versus the comparable period.

RECENT INSTITUTIONAL RESEARCH

• 2026-07-09 — Major investment banks continue to lead the M&A cycle, with June completed deal volume surging 37% year over year (Goldman Sachs). (Goldman Sachs)

Goldman Sachs’ investment banking monthly tracker shows that the current upswing in investment banking activity is being driven primarily by large bulge-bracket firms. Key data indicate that M&A deal value completed in June jumped 37% year over year and rose 53% month over month. Underwriting activity was also strong.
BOTTOM LINE

The technical structure is mixed.

WHAT TO WATCH

• A reclaim of HMA21 near $1,039.37 would be the first meaningful stabilization signal.
• A close below the nearby support zone around $1,001.52 would weaken the setup.
• Whether the operating milestones identified in recent institutional research become measurable disclosures.

Research and technical observation only; not a trade recommendation.

#Stocks #Fundamentals #TechnicalAnalysis #GS

Charts

GS chart 1
GS chart 1

Full text

GS market-structure snapshot

Latest close on July 30, 2026: $1,028.24 (+4.8% on the latest daily bar). HMA21 / HMA55: $1,039.37 / $1,071.41. 200DMA: $915.34. Relative volume: 0.85x the 20-day average.

Latest close on July 30, 2026: $1,028.24 (+4.8% on the latest daily bar). HMA21 / HMA55: $1,039.37 / $1,071.41. 200DMA: $915.34. Relative volume: 0.85x the 20-day average.

GS latest SEC/Yahoo fundamental and valuation snapshot

Latest comparable filing period: latest period. Comparable growth: net income +18.8% YoY; diluted EPS +24.3% YoY.

Latest comparable filing period: latest period.
Comparable growth: net income +18.8% YoY; diluted EPS +24.3% YoY.
Quality and cash conversion: quarterly SEC free-cash-flow proxy -$32.43B (+14.0% YoY).
Valuation snapshot: trailing P/E 15.9x; forward P/E 13.9x; P/S 4.5x.
Cash generation improved versus the comparable period.

Major investment banks continue to lead the M&A cycle, with June completed deal volume surging 37% year over year (Goldman Sachs). (Goldman Sachs)

Goldman Sachs’ investment banking monthly tracker shows that the current upswing in investment banking activity is being driven primarily by large bulge-bracket firms. Key data indicate that M&A deal value completed in June jumped 37% year over year and rose 53% month over month. Underwriting activity was also strong.

Goldman Sachs’ investment banking monthly tracker shows that the current upswing in investment banking activity is being driven primarily by large bulge-bracket firms. Key data indicate that M&A deal value completed in June jumped 37% year over year and rose 53% month over month. Underwriting activity was also strong.

← Back to archive