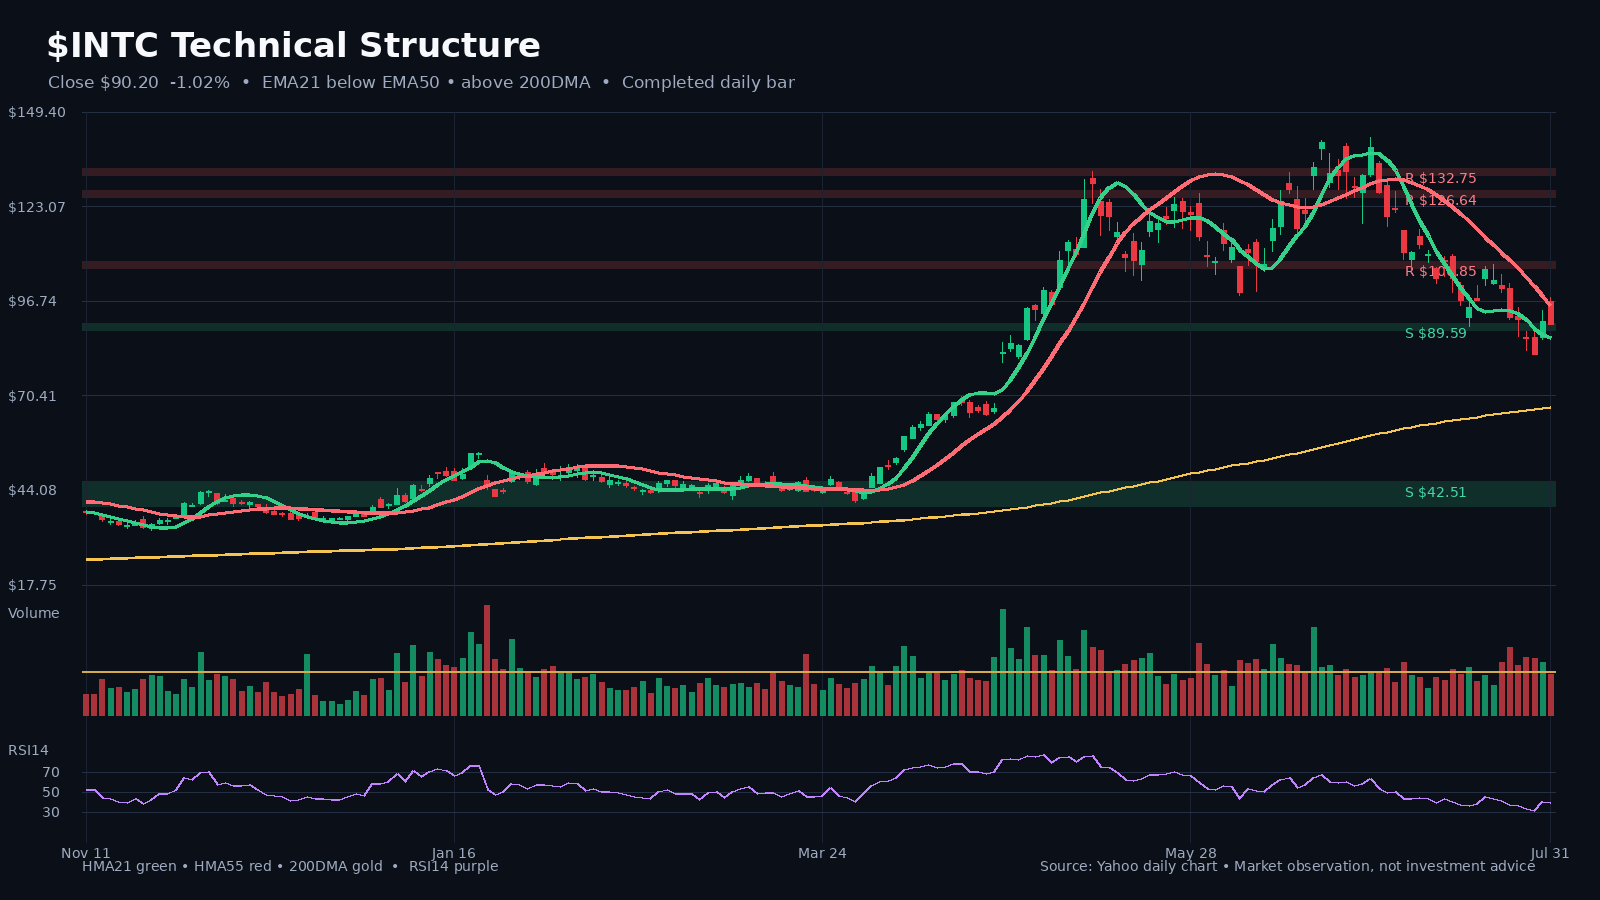
INTC market-structure snapshot
Latest close on July 31, 2026: $90.20 (-1.0% on the latest daily bar). HMA21 / HMA55: $86.51 / $95.58. 200DMA: $67.04. Relative volume: 0.92x the 20-day average.
Latest close on July 31, 2026: $90.20 (-1.0% on the latest daily bar). HMA21 / HMA55: $86.51 / $95.58. 200DMA: $67.04. Relative volume: 0.92x the 20-day average.
INTC latest SEC/Yahoo fundamental and valuation snapshot
Latest comparable filing period: 2026 Q2 ending 2026-06-27; filed 2026-07-24. Comparable growth: revenue +25.4% YoY; net income +278.1% YoY; diluted EPS +222.4% YoY.
Latest comparable filing period: 2026 Q2 ending 2026-06-27; filed 2026-07-24.
Comparable growth: revenue +25.4% YoY; net income +278.1% YoY; diluted EPS +222.4% YoY.
Quality and cash conversion: net margin -68.4% (-4572 bp YoY); six-month YTD SEC free-cash-flow proxy $1.91B (+132.5% YoY).
Valuation snapshot: forward P/E 44.3x; EV/EBITDA 29.2x; P/S 8.0x.
Net income grew faster than revenue, indicating positive earnings leverage in the comparable period.
Diluted EPS growth lagged net-income growth, making share-count effects worth monitoring.
Cash conversion moved from negative to positive on the SEC proxy.
Intel Earnings Takeaways: AI Compute Demand Is Accelerating, Benefiting Chinese Cloud and Semiconductor Stocks (Morgan Stanley)
Intel’s second-quarter earnings call sent a strong signal: demand for its Data Center and AI (DCAI) business is accelerating, the outlook for x86 server CPUs is strong, and the global industry is expected to post double-digit growth this year and next. More importantly, its custom ASIC business revenue run rate could increase from $2 billion to $4 billion. Morgan Stanley views this as a positive signal for Chinese cloud semiconductor companies and has expressed a clear preference for Aspeed Technology (5274.TWO) and Montage Technology (6809.HK/688008.SS).
Intel’s second-quarter earnings call sent a strong signal: demand for its Data Center and AI (DCAI) business is accelerating, the outlook for x86 server CPUs is strong, and the global industry is expected to post double-digit growth this year and next. More importantly, its custom ASIC business revenue run rate could increase from $2 billion to $4 billion. Morgan Stanley views this as a positive signal for Chinese cloud semiconductor companies and has expressed a clear preference for Aspeed Technology (5274.TWO) and Montage Technology (6809.HK/688008.SS).
Intel: Strong performance but surge in expenses, foundry business outlook relies on external verification, maintain neutral (Morgan Stanley)
Intel's second-quarter non-GAAP revenue was US$16.128 billion and EPS was US$0.43, significantly exceeding expectations. Based on strong confidence in the long-term foundry and packaging prospects, management increased capital expenditures to approximately US$20 billion and US$30 billion. Higher spending is expected to turn free cash flow into negative territory, and foundry success relies on new entrants to the industry rather than an internal shift in the company's culture.
Intel's second-quarter non-GAAP revenue was US$16.128 billion and EPS was US$0.43, significantly exceeding expectations. Based on strong confidence in the long-term foundry and packaging prospects, management increased capital expenditures to approximately US$20 billion and US$30 billion. Higher spending is expected to turn free cash flow into negative territory, and foundry success relies on new entrants to the industry rather than an internal shift in the company's culture.