AlphaWire

stock_deep_dive

SPOT market-structure snapshot

2026-08-05·stock-deep-dive-20260805-slot-02-1115-spot
$SPOT: multi-source stock research

Spotify Technology S.A.

MARKET STRUCTURE

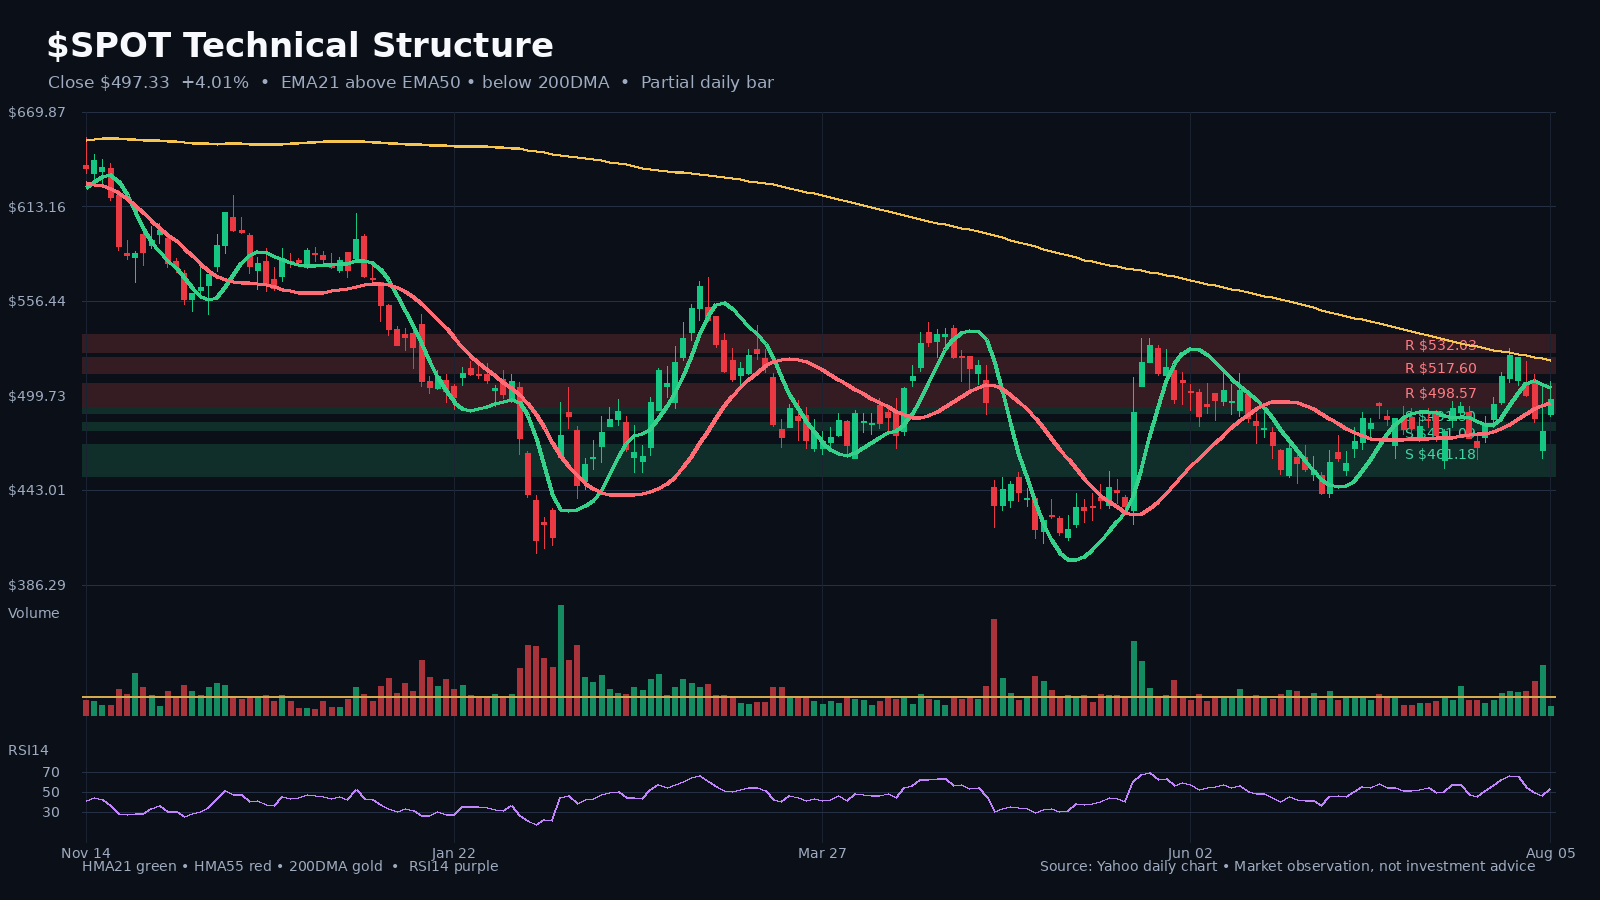
Latest close on August 5, 2026: $497.33 (+4.0% on the latest daily bar).

HMA21 / HMA55: $504.63 / $495.47. 200DMA: $520.98.

Relative volume: 0.44x the 20-day average.

Nearest support/watch zone: $491.30.

Nearest resistance/watch zone: $498.57.

Price is below the 200DMA, so the long-term trend reference is still defensive.

FUNDAMENTALS AND VALUATION

Latest comparable filing period: latest period.

Valuation snapshot: trailing P/E 34.0x; forward P/E 27.5x; EV/EBITDA 38.5x; P/S 5.8x.

Read-through:
• forward P/E is materially below trailing P/E, implying higher expected earnings

RECENT INSTITUTIONAL RESEARCH

• 2026-07-23 — Spotify’s pricing power remains strong, super-fan monetization opens up, and medium-term growth looks secure (Bernstein)

Bernstein analyzed the pricing room for Spotify’s core paid streaming subscriptions. The current potential market size for Spotify Premium, or TAM, is about $107 billion and is expected to reach $127 billion by 2030. The value-release runway is likely to extend at least through 2027, supported by competitor price matching and global price gaps.
BOTTOM LINE

The technical structure is mixed.

WHAT TO WATCH

• A reclaim of HMA21 near $504.63 would be the first meaningful stabilization signal.
• A close below the nearby support zone around $491.30 would weaken the setup.
• Whether the operating milestones identified in recent institutional research become measurable disclosures.

#Stocks #Fundamentals #TechnicalAnalysis #SPOT

Charts

SPOT chart 1
SPOT chart 1

Full text

SPOT market-structure snapshot

Latest close on August 5, 2026: $497.33 (+4.0% on the latest daily bar). HMA21 / HMA55: $504.63 / $495.47. 200DMA: $520.98. Relative volume: 0.44x the 20-day average.

Latest close on August 5, 2026: $497.33 (+4.0% on the latest daily bar). HMA21 / HMA55: $504.63 / $495.47. 200DMA: $520.98. Relative volume: 0.44x the 20-day average.

SPOT latest SEC/Yahoo fundamental and valuation snapshot

Latest comparable filing period: latest period. Valuation snapshot: trailing P/E 34.0x; forward P/E 27.5x; EV/EBITDA 38.5x; P/S 5.8x.

Latest comparable filing period: latest period.
Valuation snapshot: trailing P/E 34.0x; forward P/E 27.5x; EV/EBITDA 38.5x; P/S 5.8x.
forward P/E is materially below trailing P/E, implying higher expected earnings

Spotify’s pricing power remains strong, super-fan monetization opens up, and medium-term growth looks secure (Bernstein)

Bernstein analyzed the pricing room for Spotify’s core paid streaming subscriptions. The current potential market size for Spotify Premium, or TAM, is about $107 billion and is expected to reach $127 billion by 2030. The value-release runway is likely to extend at least through 2027, supported by competitor price matching and global price gaps.

Bernstein analyzed the pricing room for Spotify’s core paid streaming subscriptions. The current potential market size for Spotify Premium, or TAM, is about $107 billion and is expected to reach $127 billion by 2030. The value-release runway is likely to extend at least through 2027, supported by competitor price matching and global price gaps.

← Back to archive