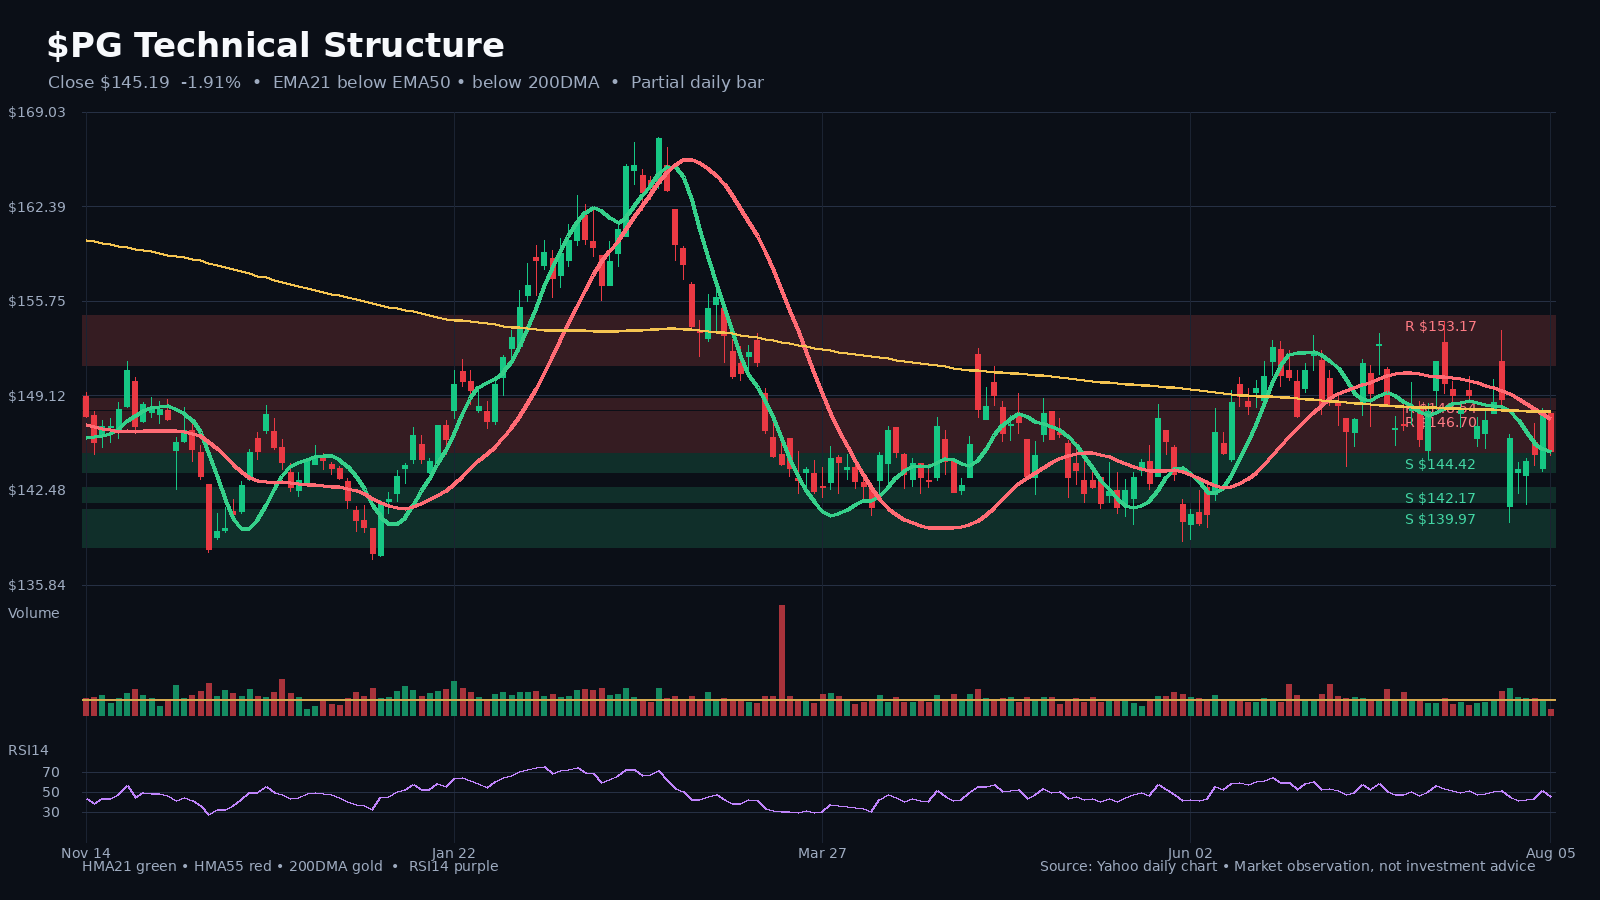
PG V3 technical snapshot
price=145.19000244140625 hma21=145.22189456163545 hma55=147.5475489709383 sma200=148.00830070495604
price=145.19000244140625 hma21=145.22189456163545 hma55=147.5475489709383 sma200=148.00830070495604
PG latest comparable SEC filing
Revenue YoY=7.377629449838189; net income YoY=4.324754576810825; EPS YoY=5.844155844155835
Revenue YoY=7.377629449838189; net income YoY=4.324754576810825; EPS YoY=5.844155844155835
PG valuation snapshot
trailing_pe=21.865211; forward_pe=19.593699; enterprise_to_ebitda=15.902; price_to_sales=3.8845212
trailing_pe=21.865211; forward_pe=19.593699; enterprise_to_ebitda=15.902; price_to_sales=3.8845212
PG Revenue
CY2026Q1: 21235000000.0; YoY=7.377629449838189
CY2026Q1: 21235000000.0; YoY=7.377629449838189
PG Net income
CY2026Q1: 3932000000.0; YoY=4.324754576810825
CY2026Q1: 3932000000.0; YoY=4.324754576810825
PG Diluted EPS
CY2026Q1: 1.63; YoY=5.844155844155835
CY2026Q1: 1.63; YoY=5.844155844155835
PG Operating income
CY2026Q1: 4576000000.0; YoY=0.39491004826678366
CY2026Q1: 4576000000.0; YoY=0.39491004826678366
PG Inventory
CY2026Q2I: 8170000000.0; YoY=8.197589723215467
CY2026Q2I: 8170000000.0; YoY=8.197589723215467
PG Capital expenditure
CY2025Q3: 1200000000.0; YoY=20.84592145015106
CY2025Q3: 1200000000.0; YoY=20.84592145015106
PROCTER & GAMBLE CO filed an 8-K with the SEC — Exhibit 99.1 earnings release
EX-99.1 2 fy2526q4amj8-kexhibit991.htm FY2526 Q4 AMJ 8-K EXHIBIT 99.1 Document News Release The Procter & Gamble Company One P&G Plaza Cincinnati, OH 45202 P&G ANNOUNCES FOURTH QUARTER AND FISCAL YEAR 2026 RESULTS Q4 ’26: Net Sales +2%; Organic Sales 0%; Diluted EPS -15%; Core EPS -3% FY ’26: Net Sales +3%; Organic Sales +1%; Diluted EPS +2%; Core EPS +1% CINCINNATI, July 29, 2026 - The Procter & Gamble Company (NYSE:PG) reported fourth quarter and fiscal year 2026 results. “Fiscal 2026 was a year of foundation building while continuing to grow sales and profit and return high levels of cash to shareowners despite a very challenging geopolitical and economic environment,” said Shailesh Jejurikar, President and Chief Executive Officer. “In fiscal 2027, we expect to deliver progress on each of these key measures despite continued volatility. We believe the best path to sustainable, balanced growth is to double down on our strategy and put the consumer first in everything we do. Stronger, integrated execution to delight consumers with superior products at a superior value. We are confident in our plans to accelerate growth from semester-to-semester, and our investments will be funded
EX-99.1 2 fy2526q4amj8-kexhibit991.htm FY2526 Q4 AMJ 8-K EXHIBIT 99.1 Document News Release The Procter & Gamble Company One P&G Plaza Cincinnati, OH 45202 P&G ANNOUNCES FOURTH QUARTER AND FISCAL YEAR 2026 RESULTS Q4 ’26: Net Sales +2%; Organic Sales 0%; Diluted EPS -15%; Core EPS -3% FY ’26: Net Sales +3%; Organic Sales +1%; Diluted EPS +2%; Core EPS +1% CINCINNATI, July 29, 2026 - The Procter & Gamble Company (NYSE:PG) reported fourth quarter and fiscal year 2026 results. “Fiscal 2026 was a year of foundation building while continuing to grow sales and profit and return high levels of cash to shareowners despite a very challenging geopolitical and economic environment,” said Shailesh Jejurikar, President and Chief Executive Officer. “In fiscal 2027, we expect to deliver progress on each of these key measures despite continued volatility. We believe the best path to sustainable, balanced growth is to double down on our strategy and put the consumer first in everything we do. Stronger, integrated execution to delight consumers with superior products at a superior value. We are confident in our plans to accelerate growth from semester-to-semester, and our investments will be funded with a strong productivity program. We are building momentum with consumers, and we are excited about the long-term opportunities ahead.” Fiscal Year ($ billions, except EPS) GAAP 2026 2025 % Change Non-GAAP* 2026 2025 % Change Net Sales $87.0 $84.3 +3% Organic Sales n/a n/a +1% Diluted EPS $6.62 $6.51 +2% Core EPS $6.89 $6.83 +1% Fourth Quarter ($ billions, except EPS) GAAP 2026 2025 % Change Non-GAAP* 2026 2025 % Change Net Sales $21.2 $20.9 +2% Organic Sales n/a n/a —% Diluted EPS $1.26 $1.48 (15)% Core EPS $1.43 $1.48 (3)% * P…
PROCTER & GAMBLE CO filed an 8-K with the SEC — Exhibit 99.1 earnings release
EX-99.1 2 fy2526q3jfm8-kexhibit991.htm FY2526 Q3 JFM 8-K EXHIBIT 99.1 Document News Release The Procter & Gamble Company One P&G Plaza Cincinnati, OH 45202 P&G ANNOUNCES FISCAL YEAR 2026 THIRD QUARTER RESULTS Net Sales +7%; Organic Sales 3% Diluted EPS $1.63, +6%; Core EPS $1.59, +3% MAINTAINS FISCAL YEAR SALES, EPS GROWTH AND CASH RETURN GUIDANCE CINCINNATI, April 24, 2026 - The Procter & Gamble Company (NYSE:PG) reported third quarter fiscal year 2026 net sales of $21.2 billion, an increase of seven percent versus the prior year. Organic sales, which excludes the impacts of foreign exchange and acquisitions and divestitures, increased three percent versus the prior year. Diluted net earnings per share were $1.63, an increase of six percent versus prior year, driven by a gain from the dissolution of the Glad joint venture business. Core earnings per share were $1.59, an increase of three percent versus prior year. Operating cash flow was $4.0 billion, and net earnings were $4.0 billion for the quarter. Adjusted free cash flow productivity was 82%. Adjusted free cash flow productivity is calculated as operating cash flow less capital spending, as a percentage of net earnings exclud
EX-99.1 2 fy2526q3jfm8-kexhibit991.htm FY2526 Q3 JFM 8-K EXHIBIT 99.1 Document News Release The Procter & Gamble Company One P&G Plaza Cincinnati, OH 45202 P&G ANNOUNCES FISCAL YEAR 2026 THIRD QUARTER RESULTS Net Sales +7%; Organic Sales 3% Diluted EPS $1.63, +6%; Core EPS $1.59, +3% MAINTAINS FISCAL YEAR SALES, EPS GROWTH AND CASH RETURN GUIDANCE CINCINNATI, April 24, 2026 - The Procter & Gamble Company (NYSE:PG) reported third quarter fiscal year 2026 net sales of $21.2 billion, an increase of seven percent versus the prior year. Organic sales, which excludes the impacts of foreign exchange and acquisitions and divestitures, increased three percent versus the prior year. Diluted net earnings per share were $1.63, an increase of six percent versus prior year, driven by a gain from the dissolution of the Glad joint venture business. Core earnings per share were $1.59, an increase of three percent versus prior year. Operating cash flow was $4.0 billion, and net earnings were $4.0 billion for the quarter. Adjusted free cash flow productivity was 82%. Adjusted free cash flow productivity is calculated as operating cash flow less capital spending, as a percentage of net earnings excluding the gain from the dissolution of the Glad joint venture business. The Company returned $3.2 billion of cash to shareowners via $2.5 billion of dividend payments and over $600 million of share repurchases. The dividend increase announced earlier this month marks the 70th consecutive year that P&G has increased its dividend and the 136th consecutive year that P&G has paid a dividend since its incorporation in 1890. Third Quarter ($ billions, except EPS) GAAP 2026 2025 % Change Non-GAAP* 2026 2025 % Change Net Sales 21.2 19.8 7% Organic Sales n/a n/a 3% Diluted…