AlphaWire

stock_deep_dive

PFE market-structure snapshot

2026-08-07·stock-deep-dive-20260807-slot-00-1045-pfe
$PFE: multi-source stock research

PFIZER INC

MARKET STRUCTURE

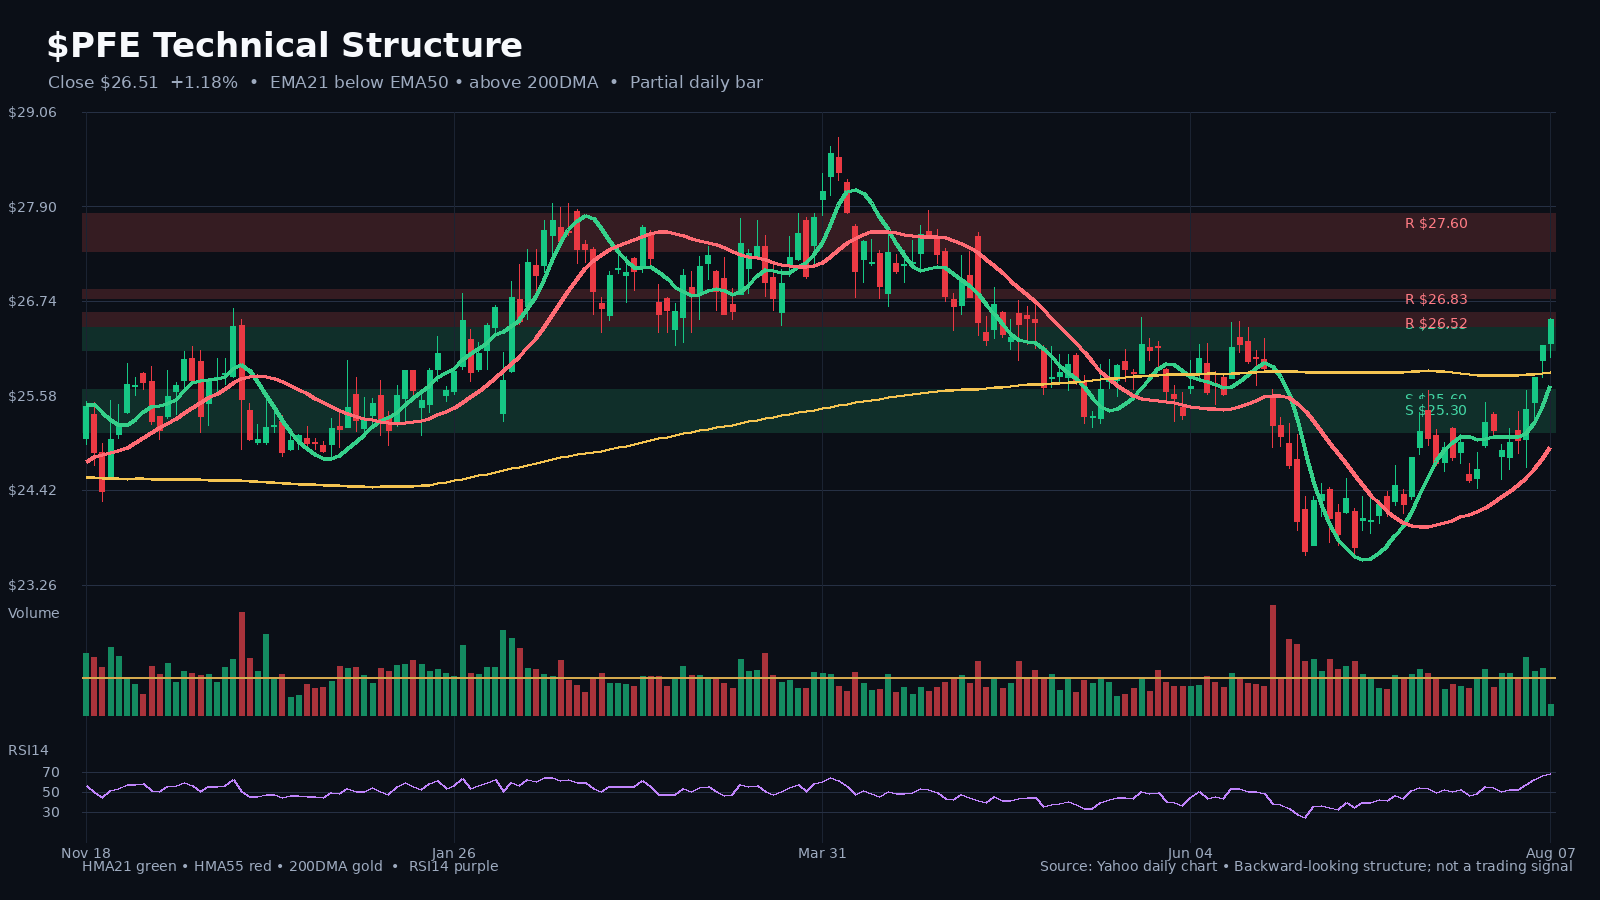
Latest close on August 7, 2026: $26.51 (+1.2% on the latest daily bar).

HMA21 / HMA55: $25.71 / $24.95. 200DMA: $25.86.

Relative volume: 0.27x the 20-day average.

Nearest support/watch zone: $26.38.

Nearest resistance/watch zone: $26.52.

Price is above the 200DMA, so the long-term trend reference is supportive.

FUNDAMENTALS AND VALUATION

Latest comparable filing period: 2026 Q2 ending 2026-06-28; filed 2026-08-04.

Comparable growth: revenue +2.6% YoY; net income -108.5% YoY; diluted EPS -107.8% YoY.

Quality and cash conversion: net margin -1.6% (-2151 bp YoY); six-month YTD SEC free-cash-flow proxy $2.48B (+334.5% YoY).

Valuation snapshot: trailing P/E 34.9x; forward P/E 9.2x; EV/EBITDA 7.9x; P/S 2.4x.

Read-through:
• Revenue growth did not convert into net-income growth in the comparable period.
• Cash generation improved versus the comparable period.

RECENT INSTITUTIONAL RESEARCH

• 2026-07-08 — Pfizer’s earnings guidance has room for an upward revision, but its pipeline remains the market’s focus (J.P. Morgan)

J.P. The report said Pfizer’s stock is currently valued at approximately 9 times projected 2027 earnings, making the valuation inexpensive, while several pipeline assets could add appeal to the long-term investment narrative.

However, the recent Phase 3 failure of sigvotatug vedotin in second-line or later non-small cell lung cancer represents a significant negative development and has reduced visibility into the development pipeline.
BOTTOM LINE

The technical structure is constructive, while the latest comparable period showed revenue growth but weaker profit conversion. The next confirmation must come from both price structure and the next reported operating data—not from narrative alone.

WHAT TO WATCH

• Holding above HMA21 near $25.71 would preserve the short-term structure.
• A close below the nearby support zone around $26.38 would weaken the setup.
• Whether the next filing confirms that revenue growth is converting into net income, EPS and cash flow.
• Whether the operating milestones identified in recent institutional research become measurable disclosures.

#Stocks #Fundamentals #TechnicalAnalysis #PFE

Charts

PFE chart 1
PFE chart 1

Full text

PFE market-structure snapshot

Latest close on August 7, 2026: $26.51 (+1.2% on the latest daily bar). HMA21 / HMA55: $25.71 / $24.95. 200DMA: $25.86. Relative volume: 0.27x the 20-day average.

Latest close on August 7, 2026: $26.51 (+1.2% on the latest daily bar). HMA21 / HMA55: $25.71 / $24.95. 200DMA: $25.86. Relative volume: 0.27x the 20-day average.

PFE latest SEC/Yahoo fundamental and valuation snapshot

Latest comparable filing period: 2026 Q2 ending 2026-06-28; filed 2026-08-04. Comparable growth: revenue +2.6% YoY; net income -108.5% YoY; diluted EPS -107.8% YoY.

Latest comparable filing period: 2026 Q2 ending 2026-06-28; filed 2026-08-04.
Comparable growth: revenue +2.6% YoY; net income -108.5% YoY; diluted EPS -107.8% YoY.
Quality and cash conversion: net margin -1.6% (-2151 bp YoY); six-month YTD SEC free-cash-flow proxy $2.48B (+334.5% YoY).
Valuation snapshot: trailing P/E 34.9x; forward P/E 9.2x; EV/EBITDA 7.9x; P/S 2.4x.
Revenue growth did not convert into net-income growth in the comparable period.
Cash generation improved versus the comparable period.

Pfizer’s earnings guidance has room for an upward revision, but its pipeline remains the market’s focus (J.P. Morgan)

J.P. The report said Pfizer’s stock is currently valued at approximately 9 times projected 2027 earnings, making the valuation inexpensive, while several pipeline assets could add appeal to the long-term investment narrative. However, the recent Phase 3 failure of sigvotatug vedotin in second-line or later non-small cell lung cancer represents a significant negative development and has reduced visibility into the development pipeline.

J.P. The report said Pfizer’s stock is currently valued at approximately 9 times projected 2027 earnings, making the valuation inexpensive, while several pipeline assets could add appeal to the long-term investment narrative. However, the recent Phase 3 failure of sigvotatug vedotin in second-line or later non-small cell lung cancer represents a significant negative development and has reduced visibility into the development pipeline.

← Back to archive