AlphaWire

stock_deep_dive

DIS market-structure snapshot

2026-08-07·stock-deep-dive-20260807-slot-05-1200-dis
$DIS: multi-source stock research

WALT DISNEY CO/

MARKET STRUCTURE

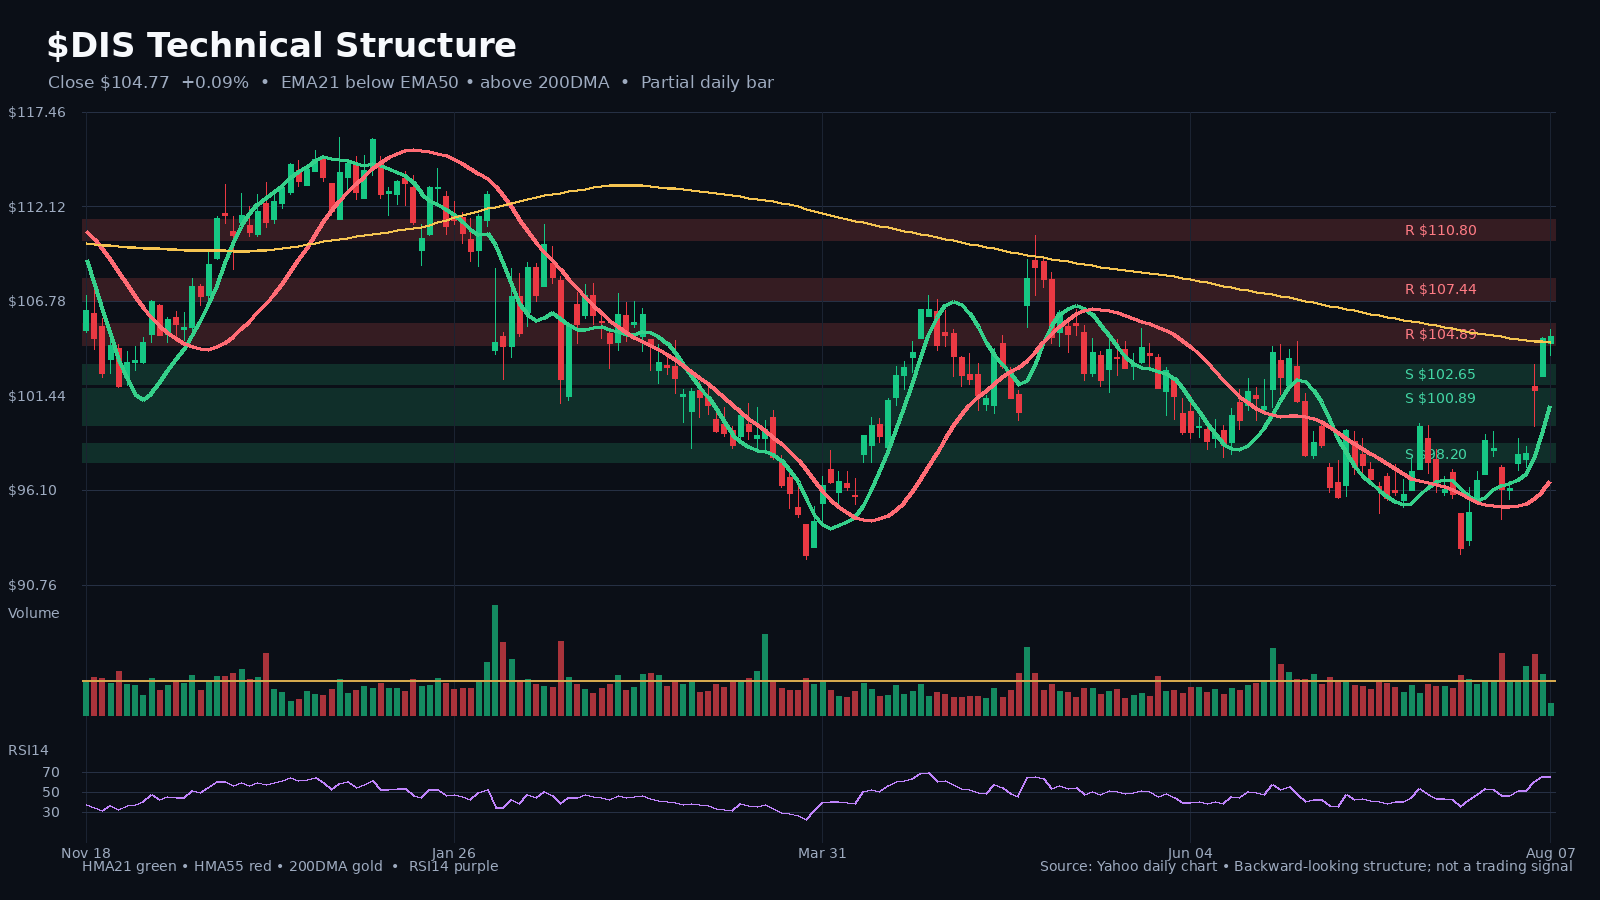
Latest close on August 7, 2026: $104.77 (+0.1% on the latest daily bar).

HMA21 / HMA55: $100.88 / $96.61. 200DMA: $104.45.

Relative volume: 0.34x the 20-day average.

Nearest support/watch zone: $103.71.

Nearest resistance/watch zone: $104.89.

Price is above the 200DMA, so the long-term trend reference is supportive.

FUNDAMENTALS AND VALUATION

Latest comparable filing period: 2026 Q3 ending 2026-06-27; filed 2026-08-05.

Comparable growth: revenue +6.8% YoY; net income -49.9% YoY; diluted EPS -48.3% YoY.

Quality and cash conversion: net margin 10.4% (-1180 bp YoY); YTD SEC free-cash-flow proxy $5.74B (-23.7% YoY).

Valuation snapshot: trailing P/E 21.6x; forward P/E 14.0x; EV/EBITDA 10.9x; P/S 1.8x.

Read-through:
• Revenue growth did not convert into net-income growth in the comparable period.
• Cash generation weakened versus the comparable period.

RECENT INSTITUTIONAL RESEARCH

• 2026-08-05 — Disney’s Fiscal Q3 Again Demonstrates Its EPS Delivery Capability; Record SVOD Margin Reinforces DTC’s Strategic Importance (J.P. Morgan)

The key developments were: - F3Q adjusted EPS came in at $2.06, the highest of the first three quarters of fiscal 2026 and up significantly year over year. - The SVOD segment posted a record profit margin of 12.9%, well above JPMorgan’s estimate of 10.5%.

- Domestic Experiences attendance increased 3%, exceeding JPMorgan’s 1% estimate, while per-capita spending rose 4%.

• 2026-07-08 — Orlando Airport passenger traffic fell 2% year-on-year, Disney’s local demand is showing signs of weakness (Goldman Sachs)

Goldman Sachs released Disney’s monthly tracking data. The core change is that the number of arrivals at Orlando Airport in May fell by 2% year-on-year to 2.334 million (domestic flights fell by 3% and international flights fell by 2%). The data is a forward-looking signal for demand for Disneyland, reflecting that local consumption may be slowing.
BOTTOM LINE

The technical structure is constructive, while the latest comparable period showed revenue growth but weaker profit conversion. The next confirmation must come from both price structure and the next reported operating data—not from narrative alone.

WHAT TO WATCH

• Holding above HMA21 near $100.88 would preserve the short-term structure.
• A close below the nearby support zone around $103.71 would weaken the setup.
• Whether the next filing confirms that revenue growth is converting into net income, EPS and cash flow.
• Whether the operating milestones identified in recent institutional research become measurable disclosures.

#Stocks #Fundamentals #TechnicalAnalysis #DIS

Charts

DIS chart 1
DIS chart 1

Full text

DIS market-structure snapshot

Latest close on August 7, 2026: $104.77 (+0.1% on the latest daily bar). HMA21 / HMA55: $100.88 / $96.61. 200DMA: $104.45. Relative volume: 0.34x the 20-day average.

Latest close on August 7, 2026: $104.77 (+0.1% on the latest daily bar). HMA21 / HMA55: $100.88 / $96.61. 200DMA: $104.45. Relative volume: 0.34x the 20-day average.

DIS latest SEC/Yahoo fundamental and valuation snapshot

Latest comparable filing period: 2026 Q3 ending 2026-06-27; filed 2026-08-05. Comparable growth: revenue +6.8% YoY; net income -49.9% YoY; diluted EPS -48.3% YoY.

Latest comparable filing period: 2026 Q3 ending 2026-06-27; filed 2026-08-05.
Comparable growth: revenue +6.8% YoY; net income -49.9% YoY; diluted EPS -48.3% YoY.
Quality and cash conversion: net margin 10.4% (-1180 bp YoY); YTD SEC free-cash-flow proxy $5.74B (-23.7% YoY).
Valuation snapshot: trailing P/E 21.6x; forward P/E 14.0x; EV/EBITDA 10.9x; P/S 1.8x.
Revenue growth did not convert into net-income growth in the comparable period.
Cash generation weakened versus the comparable period.

Disney’s Fiscal Q3 Again Demonstrates Its EPS Delivery Capability; Record SVOD Margin Reinforces DTC’s Strategic Importance (J.P. Morgan)

The key developments were: - F3Q adjusted EPS came in at $2.06, the highest of the first three quarters of fiscal 2026 and up significantly year over year. - The SVOD segment posted a record profit margin of 12.9%, well above JPMorgan’s estimate of 10.5%. - Domestic Experiences attendance increased 3%, exceeding JPMorgan’s 1% estimate, while per-capita spending rose 4%.

The key developments were: - F3Q adjusted EPS came in at $2.06, the highest of the first three quarters of fiscal 2026 and up significantly year over year. - The SVOD segment posted a record profit margin of 12.9%, well above JPMorgan’s estimate of 10.5%. - Domestic Experiences attendance increased 3%, exceeding JPMorgan’s 1% estimate, while per-capita spending rose 4%.

Orlando Airport passenger traffic fell 2% year-on-year, Disney’s local demand is showing signs of weakness (Goldman Sachs)

Goldman Sachs released Disney’s monthly tracking data. The core change is that the number of arrivals at Orlando Airport in May fell by 2% year-on-year to 2.334 million (domestic flights fell by 3% and international flights fell by 2%). The data is a forward-looking signal for demand for Disneyland, reflecting that local consumption may be slowing.

Goldman Sachs released Disney’s monthly tracking data. The core change is that the number of arrivals at Orlando Airport in May fell by 2% year-on-year to 2.334 million (domestic flights fell by 3% and international flights fell by 2%). The data is a forward-looking signal for demand for Disneyland, reflecting that local consumption may be slowing.

← Back to archive