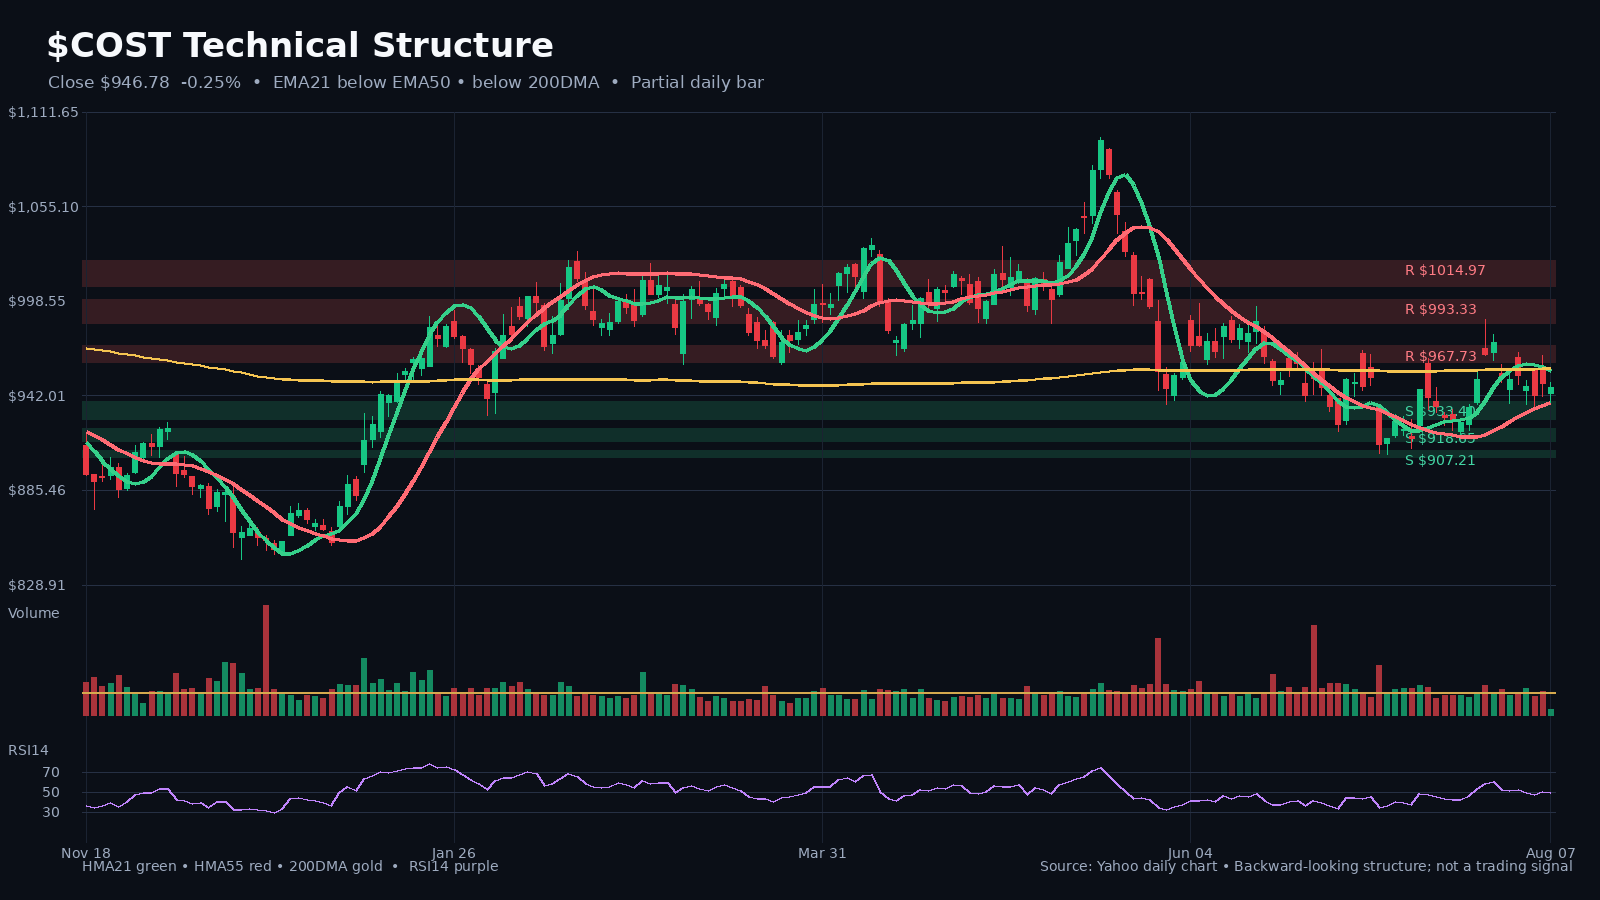
COST V3 technical snapshot
price=946.780029296875 hma21=957.17854320972 hma55=937.7716353225684 sma200=958.0812484741211
price=946.780029296875 hma21=957.17854320972 hma55=937.7716353225684 sma200=958.0812484741211
COST latest comparable SEC filing
Revenue YoY=11.584526540621788; net income YoY=15.186547556489751; EPS YoY=15.186915887850455
Revenue YoY=11.584526540621788; net income YoY=15.186547556489751; EPS YoY=15.186915887850455
COST valuation snapshot
trailing_pe=47.720768; forward_pe=41.789093; enterprise_to_ebitda=30.403; price_to_sales=1.4301618
trailing_pe=47.720768; forward_pe=41.789093; enterprise_to_ebitda=30.403; price_to_sales=1.4301618
COST Revenue
CY2026Q1: 70527000000.0; YoY=11.584526540621788
CY2026Q1: 70527000000.0; YoY=11.584526540621788
COST Net income
CY2026Q1: 2192000000.0; YoY=15.186547556489751
CY2026Q1: 2192000000.0; YoY=15.186547556489751
COST Diluted EPS
CY2026Q1: 4.93; YoY=15.186915887850455
CY2026Q1: 4.93; YoY=15.186915887850455
COST Inventory
CY2026Q1I: 19418000000.0; YoY=4.36418359668924
CY2026Q1I: 19418000000.0; YoY=4.36418359668924
COST Operating income
CY2026Q1: 2815000000.0; YoY=11.264822134387352
CY2026Q1: 2815000000.0; YoY=11.264822134387352
COST Current lease liability
CY2025Q3I: 208000000.0; YoY=16.201117318435752
CY2025Q3I: 208000000.0; YoY=16.201117318435752
COSTCO WHOLESALE CORP /NEW filed an 8-K with the SEC — Exhibit 99.1 earnings release
EX-99.1 2 costex9918-k52826.htm EX-99.1 Document Exhibit 99.1 Press Release COSTCO WHOLESALE CORPORATION REPORTS THIRD QUARTER AND YEAR-TO-DATE OPERATING RESULTS FOR FISCAL 2026 ISSAQUAH, Wash., May 28, 2026 - Costco Wholesale Corporation (“Costco” or the “Company”) (Nasdaq: COST) today announced its operating results for the third quarter (twelve weeks) and the first 36 weeks of fiscal 2026, ended May 10, 2026. Net sales for the quarter increased 11.6 percent, to $69.15 billion, from $61.96 billion last year. Net sales for the first 36 weeks increased 9.6 percent, to $203.37 billion, from $185.48 billion last year. Comparable sales for the third quarter and first 36 weeks of fiscal 2026 were as follows: 12 Weeks 12 Weeks 36 Weeks 36 Weeks Adjusted* Adjusted* U.S. 9.4% 6.8% 7.1% 6.4% Canada 10.7% 6.2% 9.1% 7.6% Other International 11.2% 5.9% 11.0% 6.6% Total Company 9.8% 6.6% 7.9% 6.6% Digitally-Enabled 21.5% 20.8% 21.6% 21.1% *Excluding the impacts from changes in gasoline prices and foreign exchange. Net income for the quarter was $2.19 billion, $4.93 per diluted share, compared to $1.90 billion, $4.28 per diluted share, last year. Net income for the first 36 weeks was $6.23 bill
EX-99.1 2 costex9918-k52826.htm EX-99.1 Document Exhibit 99.1 Press Release COSTCO WHOLESALE CORPORATION REPORTS THIRD QUARTER AND YEAR-TO-DATE OPERATING RESULTS FOR FISCAL 2026 ISSAQUAH, Wash., May 28, 2026 - Costco Wholesale Corporation (“Costco” or the “Company”) (Nasdaq: COST) today announced its operating results for the third quarter (twelve weeks) and the first 36 weeks of fiscal 2026, ended May 10, 2026. Net sales for the quarter increased 11.6 percent, to $69.15 billion, from $61.96 billion last year. Net sales for the first 36 weeks increased 9.6 percent, to $203.37 billion, from $185.48 billion last year. Comparable sales for the third quarter and first 36 weeks of fiscal 2026 were as follows: 12 Weeks 12 Weeks 36 Weeks 36 Weeks Adjusted* Adjusted* U.S. 9.4% 6.8% 7.1% 6.4% Canada 10.7% 6.2% 9.1% 7.6% Other International 11.2% 5.9% 11.0% 6.6% Total Company 9.8% 6.6% 7.9% 6.6% Digitally-Enabled 21.5% 20.8% 21.6% 21.1% *Excluding the impacts from changes in gasoline prices and foreign exchange. Net income for the quarter was $2.19 billion, $4.93 per diluted share, compared to $1.90 billion, $4.28 per diluted share, last year. Net income for the first 36 weeks was $6.23 billion, $14.01 per diluted share, compared to $5.49 billion, $12.34 per diluted share, last year. Costco currently operates 931 warehouses, including 639 in the United States and Puerto Rico, 115 in Canada, 43 in Mexico, 37 in Japan, 29 in the United Kingdom, 20 in Korea, 15 in Australia, 14 in Taiwan, seven in China, five in Spain, three in France, two in Sweden, and one each in Iceland, and New Zealand. Costco also operates e-commerce sites in the U.S., Canada, the U.K., Mexico, Korea, Taiwan, Japan, Australia, and China. A conference call to discuss…