AlphaWire

stock_deep_dive

WMT market-structure snapshot

2026-08-13·stock-deep-dive-20260813-slot-05-1200-wmt
$WMT: multi-source stock research

WALMART INC.

MARKET STRUCTURE

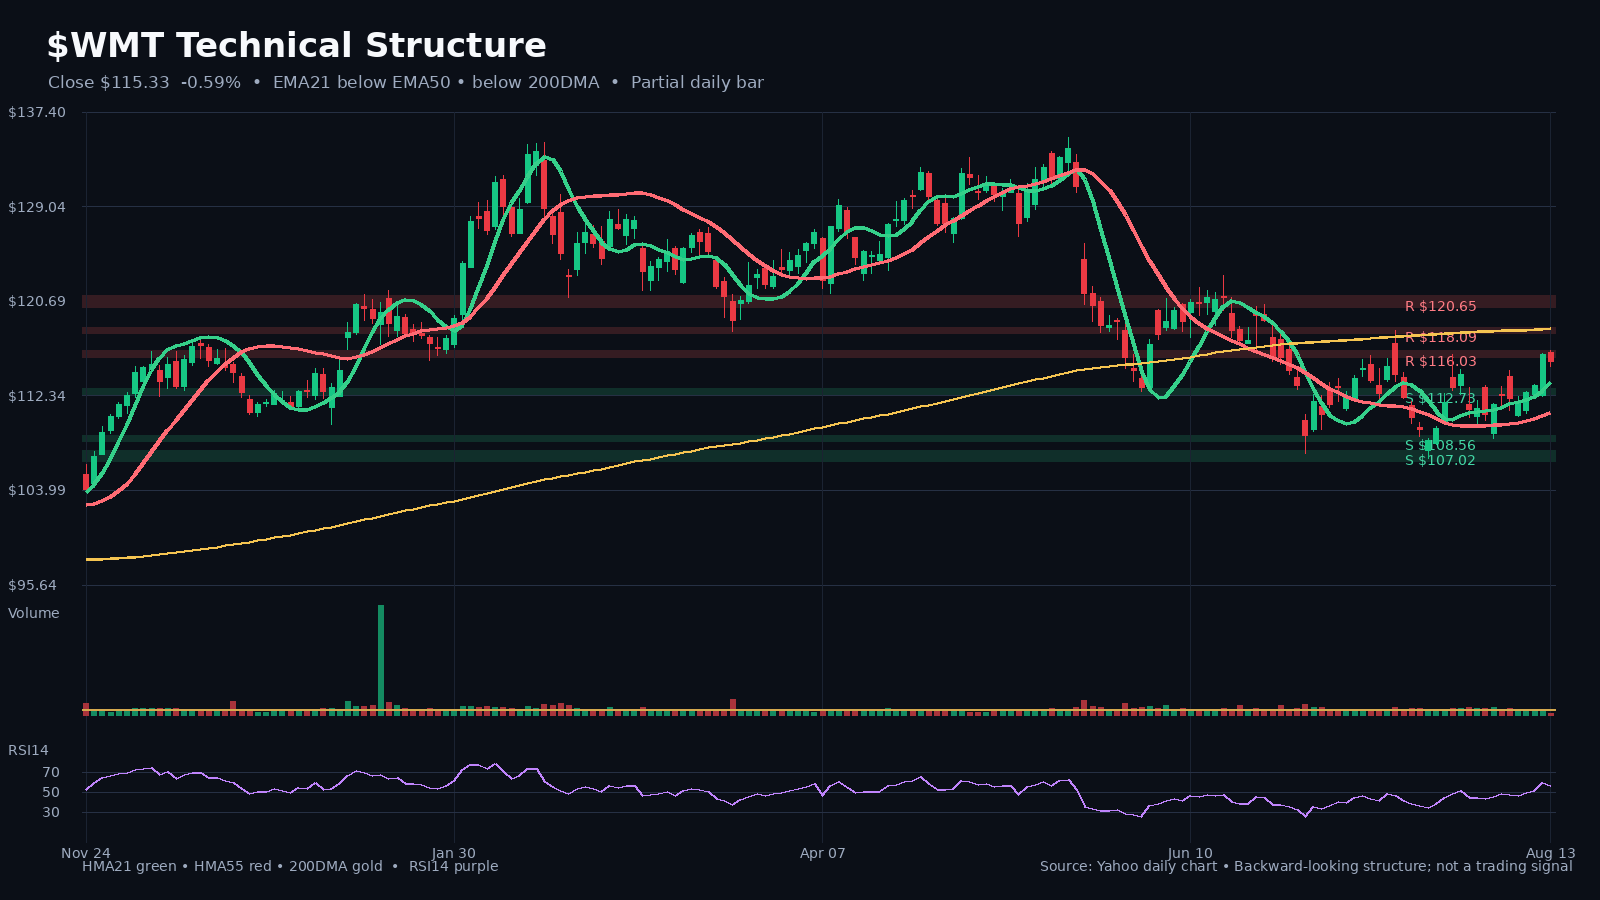
Latest close on August 13, 2026: $115.33 (-0.6% on the latest daily bar).

HMA21 / HMA55: $113.53 / $110.88. 200DMA: $118.26.

Relative volume: 0.27x the 20-day average.

Nearest support/watch zone: $114.89.

Nearest resistance/watch zone: $116.03.

Price is below the 200DMA, so the long-term trend reference is still defensive.

FUNDAMENTALS AND VALUATION

Latest comparable filing period: 2027 Q1 ending 2026-04-30; filed 2026-05-29.

Comparable growth: revenue +7.1% YoY; net income +18.8% YoY; diluted EPS +19.6% YoY.

Quality and cash conversion: net margin 3.0% (+30 bp YoY); quarterly SEC free-cash-flow proxy -$1.95B (-557.9% YoY).

Valuation snapshot: trailing P/E 39.6x; forward P/E 35.1x; EV/EBITDA 22.2x; P/S 1.3x.

Read-through:
• Net income grew faster than revenue, indicating positive earnings leverage in the comparable period.
• Cash generation weakened versus the comparable period.

RECENT INSTITUTIONAL RESEARCH

• 2026-07-19 — The era of smart e-commerce is coming and will contribute 6% of incremental GMV in the next five years. Amazon and Alibaba are the kings (Morgan Stanley)

Morgan Stanley released an in-depth report, pointing out that AI-driven agents are becoming personal digital shopping assistants.

It is expected that more than 20% of e-commerce GMV will be affected in the next five years, bringing about a 6% increase in the total market size, pushing the scale of global e-commerce to reach 7 trillion US dollars in 2030, and the CAGR from 2025 to 2030 will increase from the previous 7% to 9%.

• 2026-07-14 — The market is overly worried about Walmart’s price war, and omni-channel profitability supports the rise in stock prices (Bernstein)

The report believes that the market's concerns about the impact of Walmart's price investment on profits are excessive, and the company can use tariff rebates to hedge costs and continue to gain market share. The unsubsidized EBIT profit margin of core U.S. e-commerce companies is expected to turn positive in FY 2030.
BOTTOM LINE

The technical structure is mixed, while the latest comparable period showed growth in both revenue and net income. The next confirmation must come from both price structure and the next reported operating data—not from narrative alone.

WHAT TO WATCH

• Holding above HMA21 near $113.53 would preserve the short-term structure.
• A close below the nearby support zone around $114.89 would weaken the setup.
• Whether the next filing confirms that revenue growth is converting into net income, EPS and cash flow.
• Whether the operating milestones identified in recent institutional research become measurable disclosures.

#Stocks #Fundamentals #TechnicalAnalysis #WMT

Charts

WMT chart 1
WMT chart 1

Full text

WMT market-structure snapshot

Latest close on August 13, 2026: $115.33 (-0.6% on the latest daily bar). HMA21 / HMA55: $113.53 / $110.88. 200DMA: $118.26. Relative volume: 0.27x the 20-day average.

Latest close on August 13, 2026: $115.33 (-0.6% on the latest daily bar). HMA21 / HMA55: $113.53 / $110.88. 200DMA: $118.26. Relative volume: 0.27x the 20-day average.

WMT latest SEC/Yahoo fundamental and valuation snapshot

Latest comparable filing period: 2027 Q1 ending 2026-04-30; filed 2026-05-29. Comparable growth: revenue +7.1% YoY; net income +18.8% YoY; diluted EPS +19.6% YoY.

Latest comparable filing period: 2027 Q1 ending 2026-04-30; filed 2026-05-29.
Comparable growth: revenue +7.1% YoY; net income +18.8% YoY; diluted EPS +19.6% YoY.
Quality and cash conversion: net margin 3.0% (+30 bp YoY); quarterly SEC free-cash-flow proxy -$1.95B (-557.9% YoY).
Valuation snapshot: trailing P/E 39.6x; forward P/E 35.1x; EV/EBITDA 22.2x; P/S 1.3x.
Net income grew faster than revenue, indicating positive earnings leverage in the comparable period.
Cash generation weakened versus the comparable period.

The era of smart e-commerce is coming and will contribute 6% of incremental GMV in the next five years. Amazon and Alibaba are the kings (Morgan Stanley)

Morgan Stanley released an in-depth report, pointing out that AI-driven agents are becoming personal digital shopping assistants. It is expected that more than 20% of e-commerce GMV will be affected in the next five years, bringing about a 6% increase in the total market size, pushing the scale of global e-commerce to reach 7 trillion US dollars in 2030, and the CAGR from 2025 to 2030 will increase from the previous 7% to 9%.

Morgan Stanley released an in-depth report, pointing out that AI-driven agents are becoming personal digital shopping assistants. It is expected that more than 20% of e-commerce GMV will be affected in the next five years, bringing about a 6% increase in the total market size, pushing the scale of global e-commerce to reach 7 trillion US dollars in 2030, and the CAGR from 2025 to 2030 will increase from the previous 7% to 9%.

The market is overly worried about Walmart’s price war, and omni-channel profitability supports the rise in stock prices (Bernstein)

The report believes that the market's concerns about the impact of Walmart's price investment on profits are excessive, and the company can use tariff rebates to hedge costs and continue to gain market share. The unsubsidized EBIT profit margin of core U.S. e-commerce companies is expected to turn positive in FY 2030.

The report believes that the market's concerns about the impact of Walmart's price investment on profits are excessive, and the company can use tariff rebates to hedge costs and continue to gain market share. The unsubsidized EBIT profit margin of core U.S. e-commerce companies is expected to turn positive in FY 2030.

← Back to archive