AlphaWire

stock_deep_dive

MU market-structure snapshot

2026-08-13·stock-deep-dive-20260813-slot-19-1530-mu
$MU: multi-source stock research

Micron Technology, Inc.

MARKET STRUCTURE

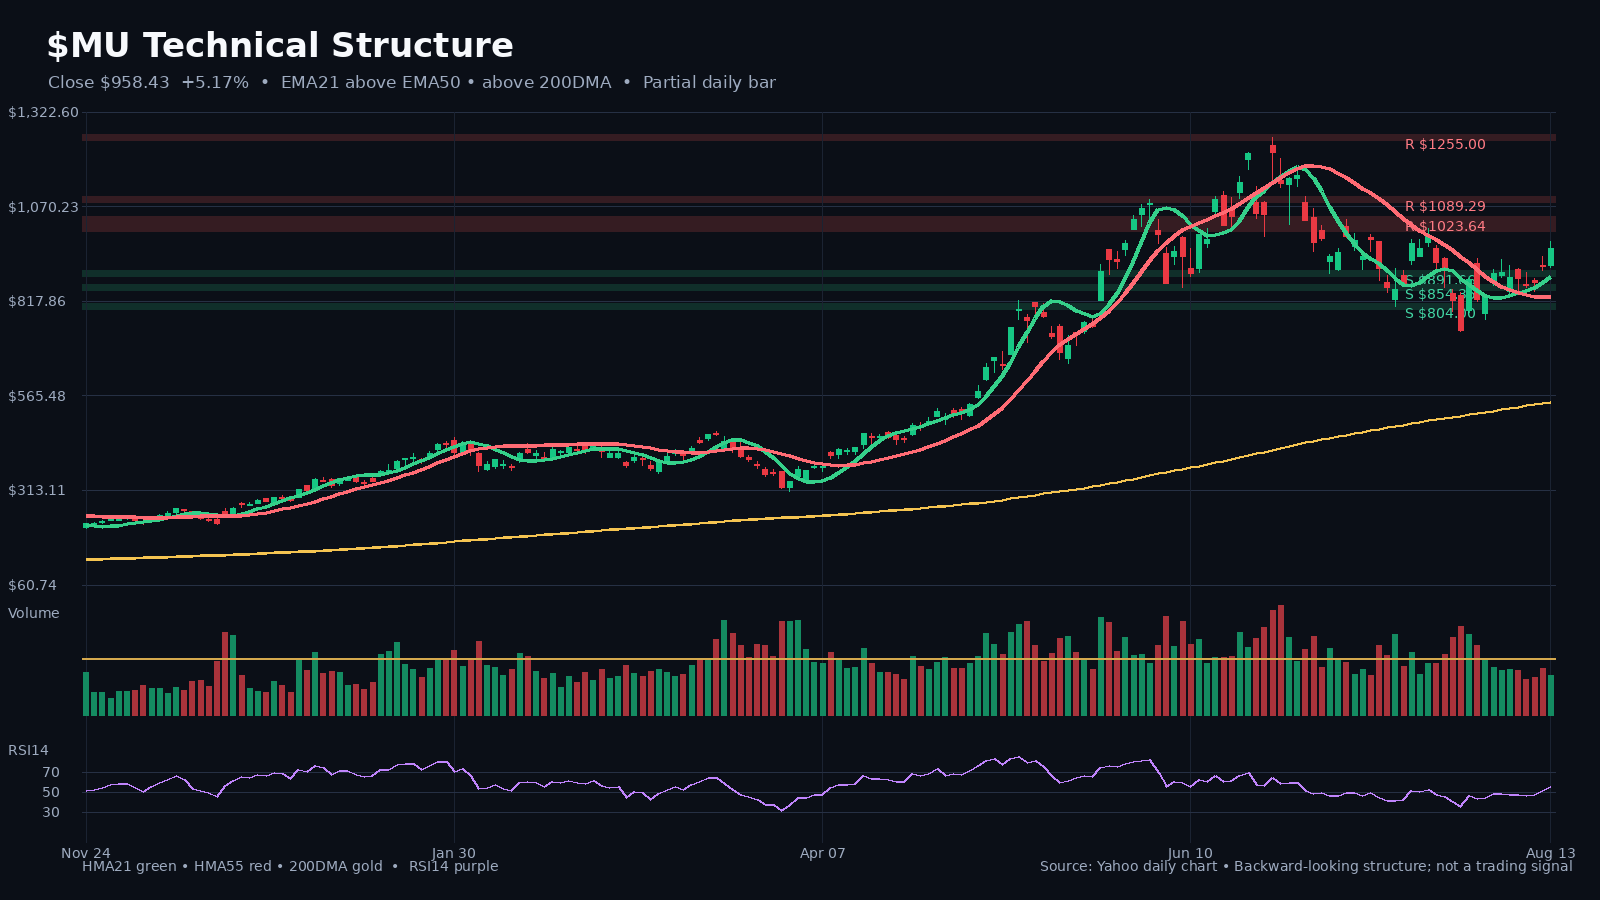
Latest close on August 13, 2026: $958.43 (+5.2% on the latest daily bar).

HMA21 / HMA55: $884.76 / $830.59. 200DMA: $548.89.

Relative volume: 0.70x the 20-day average.

Nearest support/watch zone: $906.50.

Nearest resistance/watch zone: $978.00.

Price is above the 200DMA, so the long-term trend reference is supportive.

FUNDAMENTALS AND VALUATION

Latest comparable filing period: 2026 Q3 ending 2026-05-28; filed 2026-06-25.

Comparable growth: revenue +345.7% YoY; net income +1398.3% YoY; diluted EPS +1368.5% YoY.

Quality and cash conversion: net margin 68.1% (+4786 bp YoY); YTD SEC free-cash-flow proxy $26.10B (+1535.3% YoY).

Valuation snapshot: trailing P/E 21.7x; forward P/E 6.2x; EV/EBITDA 14.8x; P/S 12.0x.

Read-through:
• Net income grew faster than revenue, indicating positive earnings leverage in the comparable period.
• Diluted EPS growth lagged net-income growth, making share-count effects worth monitoring.
• Cash generation improved versus the comparable period.

RECENT INSTITUTIONAL RESEARCH

• 2026-08-10 — June WSTS Semiconductor Data Show Stronger-Than-Seasonal Growth, Spreading From Memory to Non-Memory Chips; Industry Size Seen Reaching $2.25 Trillion… (J.P.
Morgan)

A J.P. Morgan report shows that WSTS semiconductor industry sales reached $152 billion in June, up 134% year over year versus 128% growth in May. Month over month, sales rose 12%, significantly exceeding the historical June seasonal increase of 8%.

• 2026-08-10 — Short-term NAND noise does not change the tighter DRAM supply-demand outlook, especially for HBM; reiterate Buy (UBS). (UBS)

Although the recent sequential increase in NAND ASPs was slightly below expectations, with the forecast revised down from +28% to +20%, supply-demand conditions in DRAM—particularly HBM—are tighter than expected. Pricing for HBM4 and HBM4E is also stronger than previously anticipated, with HBM4E potentially exceeding $30/GB.

UBS raised its calendar 2027 industry HBM ASP growth forecast from +67% to +79%.

BOTTOM LINE

The technical structure is constructive, while the latest comparable period showed growth in both revenue and net income. The next confirmation must come from both price structure and the next reported operating data—not from narrative alone.

WHAT TO WATCH

• Holding above HMA21 near $884.76 would preserve the short-term structure.
• A close below the nearby support zone around $906.50 would weaken the setup.
• Whether the next filing confirms that revenue growth is converting into net income, EPS and cash flow.
• Whether the operating milestones identified in recent institutional research become measurable disclosures.

#Stocks #Fundamentals #TechnicalAnalysis #MU

Charts

MU chart 1
MU chart 1

Full text

MU market-structure snapshot

Latest close on August 13, 2026: $958.43 (+5.2% on the latest daily bar). HMA21 / HMA55: $884.76 / $830.59. 200DMA: $548.89. Relative volume: 0.70x the 20-day average.

Latest close on August 13, 2026: $958.43 (+5.2% on the latest daily bar). HMA21 / HMA55: $884.76 / $830.59. 200DMA: $548.89. Relative volume: 0.70x the 20-day average.

MU latest SEC/Yahoo fundamental and valuation snapshot

Latest comparable filing period: 2026 Q3 ending 2026-05-28; filed 2026-06-25. Comparable growth: revenue +345.7% YoY; net income +1398.3% YoY; diluted EPS +1368.5% YoY.

Latest comparable filing period: 2026 Q3 ending 2026-05-28; filed 2026-06-25.
Comparable growth: revenue +345.7% YoY; net income +1398.3% YoY; diluted EPS +1368.5% YoY.
Quality and cash conversion: net margin 68.1% (+4786 bp YoY); YTD SEC free-cash-flow proxy $26.10B (+1535.3% YoY).
Valuation snapshot: trailing P/E 21.7x; forward P/E 6.2x; EV/EBITDA 14.8x; P/S 12.0x.
Net income grew faster than revenue, indicating positive earnings leverage in the comparable period.
Diluted EPS growth lagged net-income growth, making share-count effects worth monitoring.
Cash generation improved versus the comparable period.

June WSTS Semiconductor Data Show Stronger-Than-Seasonal Growth, Spreading From Memory to Non-Memory Chips; Industry Size Seen Reaching $2.25 Trillion… (J.P. Morgan)

A J.P. Morgan report shows that WSTS semiconductor industry sales reached $152 billion in June, up 134% year over year versus 128% growth in May. Month over month, sales rose 12%, significantly exceeding the historical June seasonal increase of 8%.

A J.P. Morgan report shows that WSTS semiconductor industry sales reached $152 billion in June, up 134% year over year versus 128% growth in May. Month over month, sales rose 12%, significantly exceeding the historical June seasonal increase of 8%.

Short-term NAND noise does not change the tighter DRAM supply-demand outlook, especially for HBM; reiterate Buy (UBS). (UBS)

Although the recent sequential increase in NAND ASPs was slightly below expectations, with the forecast revised down from +28% to +20%, supply-demand conditions in DRAM—particularly HBM—are tighter than expected. Pricing for HBM4 and HBM4E is also stronger than previously anticipated, with HBM4E potentially exceeding $30/GB. UBS raised its calendar 2027 industry HBM ASP growth forecast from +67% to +79%.
Although the recent sequential increase in NAND ASPs was slightly below expectations, with the forecast revised down from +28% to +20%, supply-demand conditions in DRAM—particularly HBM—are tighter than expected. Pricing for HBM4 and HBM4E is also stronger than previously anticipated, with HBM4E potentially exceeding $30/GB. UBS raised its calendar 2027 industry HBM ASP growth forecast from +67% to +79%.

← Back to archive